Key points
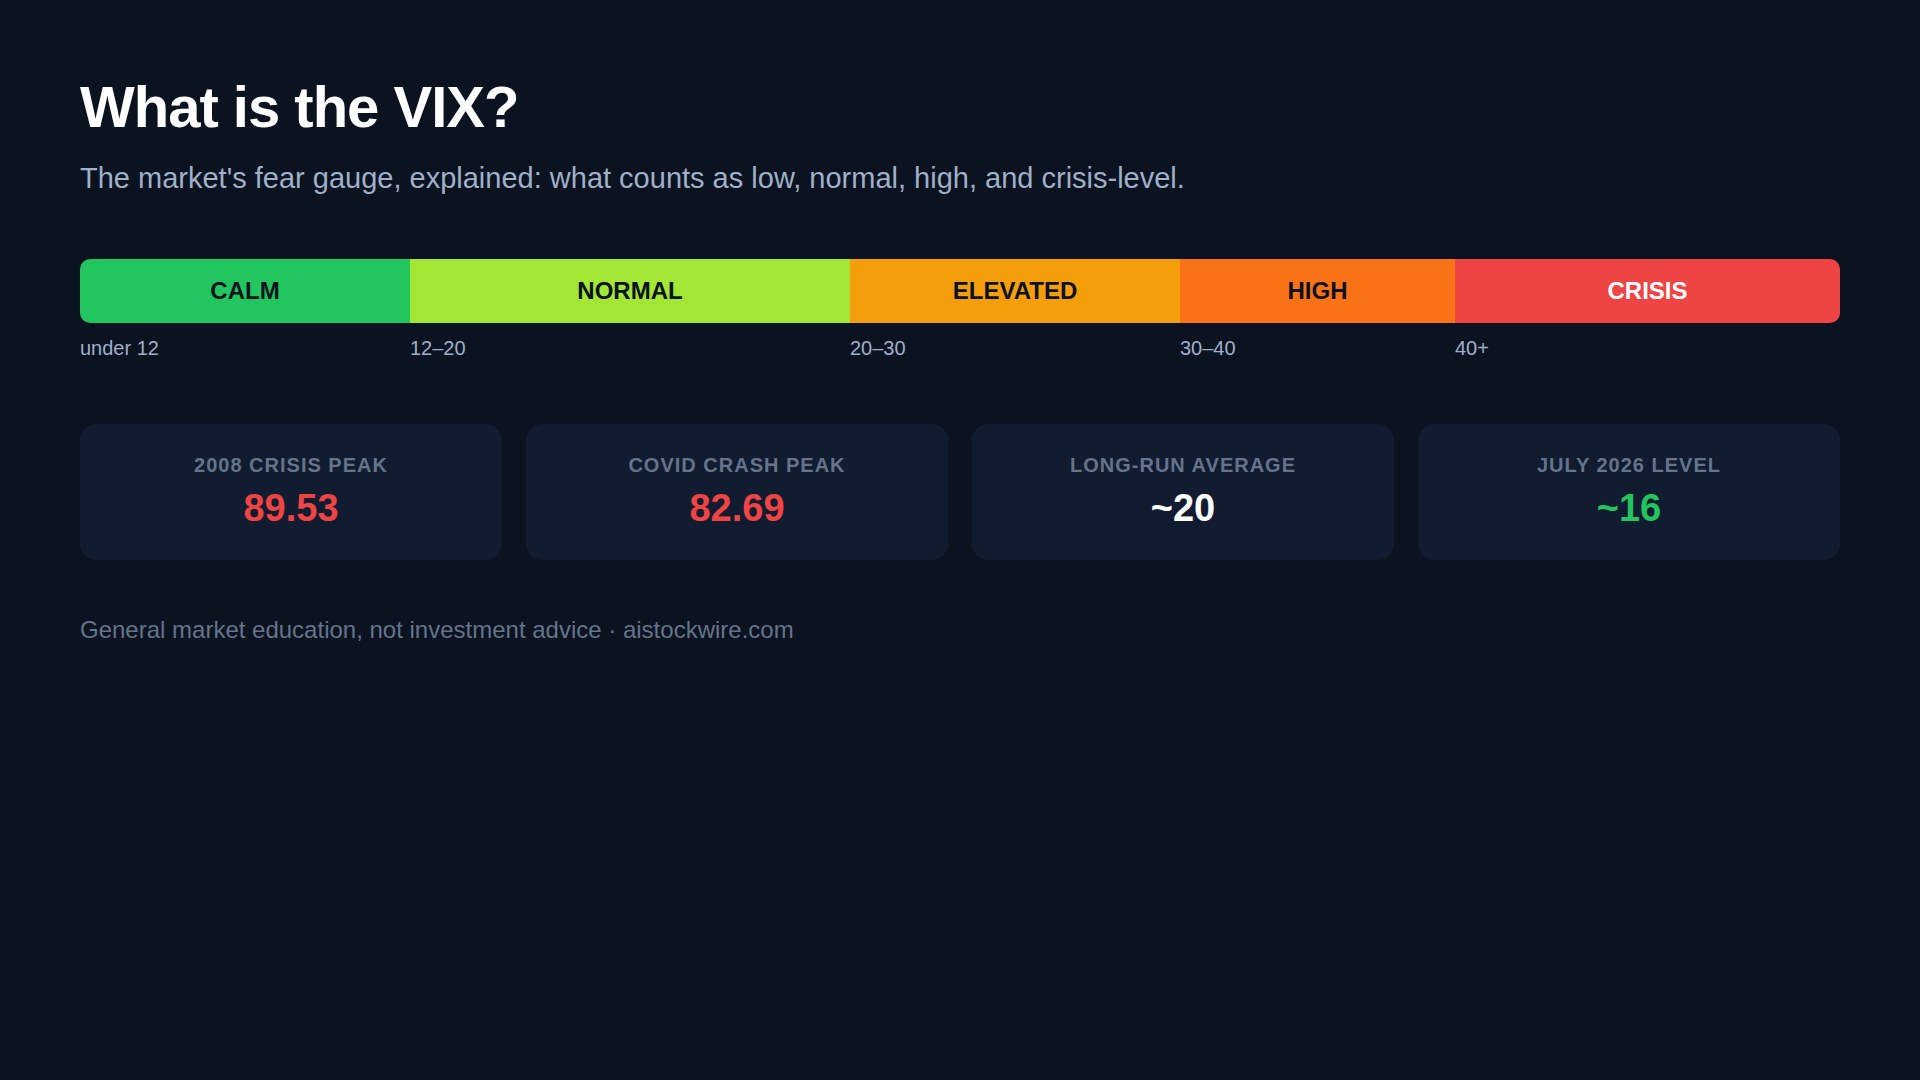
- The VIX measures how much movement options traders expect in the S&P 500 over the next 30 days, with no signal on direction. Rough bands: under 15 is quiet, high teens to low 20s is normal, 30-plus is elevated, 40-plus is crisis territory. The VIX dipped below 11 in April 2026, rare enough to notice.
- A high VIX is not automatically bad news. Options sellers earn richer premiums when it rises, and plenty of professional traders actively root for it.
- You cannot buy the VIX itself, only futures, options, or funds like VXX and UVXY, and those funds are built to bleed value in calm markets.
- Spikes fade. Once the VIX closes above 30, it has historically been lower again within two trading weeks about 78% of the time.
People treat the VIX like a mood ring for the stock market, and that gets the mechanics backward. It is a price, set by real money in the options market, on how far the S&P 500 is expected to move over the next month. Whether that move turns out to be good or bad for you personally has nothing to do with the number itself. A weekend headline, like Iran's strikes rattling futures, can move it just as fast as an earnings miss.
The math, briefly
The Cboe Volatility Index is built from live S&P 500 option prices, blended across near-dated expirations and interpolated into a running 30-day estimate, then annualized. Cboe publishes the full methodology if you want the formula itself. What actually matters for reading the number day to day: a reading of 20 prices in roughly a 20 percent annualized swing, with no view baked in on which way that swing goes. A name everyone expects to double and a name everyone expects to go to zero can generate the exact same number.
Where the bands actually sit
| Band | Range | What it usually means |
|---|---|---|
| Quiet | Under 15 | Low expected movement. April 2026 briefly dipped under 11. |
| Normal | High teens to low 20s | Where the index spends most of its time historically. |
| Elevated | 30 and up | Real uncertainty, most spikes fade within two trading weeks. |
| Crisis | 40 and up | Only two stretches in VIX history: 2008 and 2020. |
Everything above 40 traces back to one of two events. The 2008 stretch started the day Lehman Brothers went under and did not drop back below 40 for eight months. The 2020 stretch was shorter and sharper, driven entirely by COVID. Full numbers and dates for both are in the sources below rather than repeated here, since Cboe and Macroption already track this better than a paragraph can.
2022 made headlines and stayed short of that top tier. So did the 2024 carry-trade unwind, even though it briefly spiked past 60 intraday before closing back under 40. Last year's tariff shock got the closest of the three, spiking into the low 50s before unwinding almost as fast as it hit, and still landed well under the 2008 and 2020 marks. The gap between "loud" and "40-plus" is bigger than headlines usually make it sound.
Why plenty of good traders want it high
Options premium scales with implied volatility, so anyone selling covered calls, cash-secured puts, or credit spreads for income gets paid more when the VIX is up. Nobody running that strategy is rooting for a crash, exactly, but the paycheck at a 12 print looks nothing like the paycheck at a 25 print, and that difference shows up directly in the account. Bigger ranges also mean more entries for active traders, and a real selloff is exactly when value investors go looking for good businesses at a worse price than last week. "Fear gauge" describes one reaction to a high reading. It is not the only one.
Trading it yourself is where the real risk lives
You cannot buy the index itself. Exposure has to run through VIX futures, VIX options, or a fund like VXX, UVXY, or VIXY that holds rolling futures contracts rather than the index directly. The mechanical problem is contango: those futures usually price further-out contracts higher than the ones about to expire, so a long-volatility fund is stuck rolling out of the cheap one and into the expensive one on a schedule, month after month. That drag has run an estimated 5 to 10 percent a month in stretches with no crash at all to blame it on.
The specific inverse-note blowup everyone cites in this context already has its own detailed writeups, one is linked below, so I will skip re-telling it in full. Betting that volatility stays low is not automatically the safer side of the trade. One bad session has erased entire years of steady gains for people on that side of it before, and it happened fast enough that most holders had no real chance to react.
Bottom line
The VIX prices uncertainty, not outcomes, and whether that uncertainty is good or bad for you depends entirely on what you happen to be doing that month. A position worth sizing one way at a 13 VIX deserves a different size at 30. Beyond that, my actual advice is narrower than most people expect: read the number, do not trade it directly until contango actually makes sense to you, and let the products themselves earn your trust before your money.
Sources
- Cboe, VIX Index methodology and tradable products
- iPresage, VIX mean reversion study (78.4% lower within 10 trading days after a close above 30)
- CNBC, VIX closes at record high, March 16, 2020
- CNBC, VIX spikes on yen carry-trade unwind, August 2024
- Fortune, VIX levels through the 2025 tariff selloff
- FinancialContent MarketMinute, VIX drops below 11, April 2026
- Sixfigureinvesting.com, The February 2018 volatility spike and XIV's termination
This reflects my own opinion, not investment advice. VIX levels and the value of any VIX-linked fund change constantly. Leveraged and inverse volatility products carry substantial risk of loss, including total loss, and are generally intended for short-term trading rather than long-term holding. Always do your own research and consider speaking with a licensed financial professional before trading volatility products.