Key points
- July is normally one of tech's best months: the Nasdaq 100 has closed higher in roughly 67% of Julys over the past 40 years, with some of the lowest volatility on the calendar.
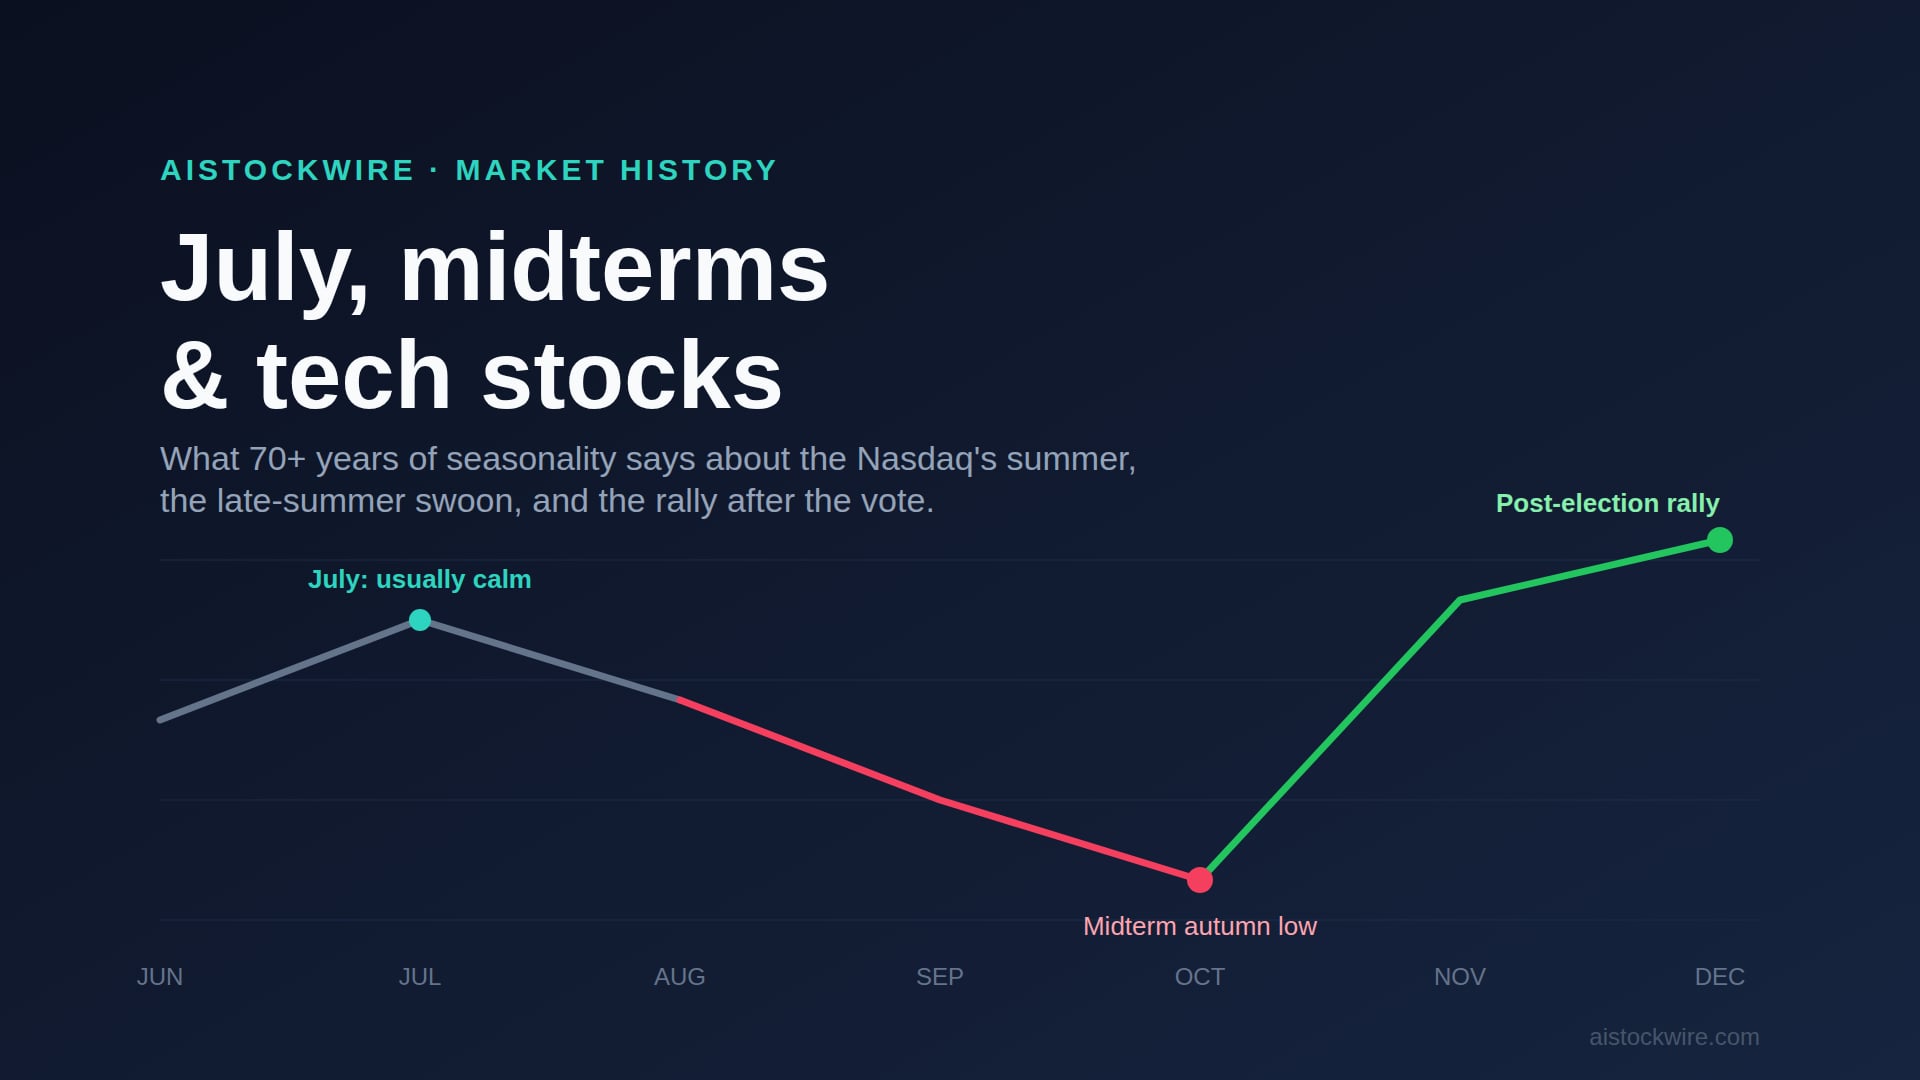
- Midterm years break the calm. Since 1950 the S&P 500 has averaged a peak-to-trough drop of about 17%, usually bottoming between August and October, not July.
- The payoff comes after the vote: the S&P 500 has gained an average of roughly 16% in the 12 months after a midterm and has not been negative over that window since 1962.
July starts in a few days, and tech is in a strange spot. A few weeks ago the Nasdaq closed at a record 27,094. As of Friday it was back down to 25,298, off more than 6 percent, as investors got nervous about how much money the AI buildout is actually going to cost. It did not help that OpenAI is reportedly pushing its IPO into next year. On top of that, 2026 is a midterm election year. Those two facts pull in opposite directions, and the history behind them is worth knowing before you read too much into whatever the market does next month.
Normally, July is tech's best friend
For most of the last 40 years, July has been kind to tech. The Nasdaq 100 has finished the month higher about two-thirds of the time, close to 67 percent, which makes it one of the most reliable months on the calendar for the index. It also tends to be one of the quietest, with below-average volume and some of the lowest volatility of the year. Earnings season kicks off mid-month, and in a good year the big names set the tone for the back half. If all you knew was the month, you would lean bullish.
Midterm years do not follow the usual script
Here is the catch. Going back to 1950, the S&P 500 has averaged a peak-to-trough drop of about 17 percent during midterm years, and that slide usually plays out between late spring and the autumn. The weakest stretch is August and September. September on its own has historically been the worst month of the year for stocks, and in midterm years the late-summer air gets even thinner.
Why? Markets hate uncertainty, and a midterm is a big question mark hanging over tax policy, spending, and which party controls Congress. Investors tend to sit on their hands until the picture clears. The whole year tends to be a grind: the S&P has averaged just under 6 percent in midterm years versus roughly 10 percent in a normal one.
So what about July specifically?
This is where the two patterns meet, and the answer is more reassuring than you would think. The midterm swoon usually bottoms in August, September, or October, not July. July tends to be the last calm month before the chop, the eye of the storm. It often holds up fine, sometimes better than fine, and the turbulence shows up later in the summer.
So the historical playbook for a July like this one is roughly this: do not be shocked if tech has a decent month, and do not get complacent about what comes after it.
Why tech feels all of this more than the rest of the market
Tech swings harder in both directions, and right now that is truer than usual. A handful of AI names are doing the heavy lifting for the entire market. Micron (MU), Nvidia (NVDA), and Alphabet (GOOGL) alone account for more than 40 percent of the upward revisions to S&P 500 earnings estimates this year. When that much of the index's story rides on a few chip and AI stocks, any wobble in AI sentiment, like the data-center cost worry that knocked the Nasdaq down this week, hits tech-heavy portfolios first and hardest. The midterm overhang is landing on an already twitchy sector.
The part most people forget: the rebound
Now the good news, and it is the most consistent piece of the whole pattern. Once the votes are counted, stocks have historically taken off. The S&P 500 has averaged about a 16 percent gain in the 12 months after a midterm election, and measured from the actual autumn low, the bounce has averaged closer to 32 percent. Most striking of all: the S&P has not posted a negative return in the 12 months following a midterm since 1962. Not once in more than 60 years.
That does not mean it cannot happen. It means the odds have strongly favored the investor who did not panic out during the August-to-October soft patch, and who treated the weakness as a dip to buy rather than a reason to run.
What it adds up to for 2026
Put the pieces together and the setup is unusual. Tech is near records but already shaking off some AI-spending jitters, July's seasonal tailwind is real but tends to fade by August, and the midterm calendar argues for a bumpier late summer followed by a historically strong finish to the year.
A few honest caveats. Seasonality is a tendency, not a promise. We are working with fewer than 20 midterm years since 1950, which is a small sample, and averages hide some ugly individual years (2002 and 2022 were both brutal). And this cycle has a wildcard the history books never had: an AI capital-spending boom big enough to move the whole index on its own. That can cut both ways. It could power tech straight through the seasonal weakness, or it could be the very thing that cracks if spending expectations get ahead of reality.
The pattern is a map, not a guarantee. But it is a map worth having in front of you before the headlines start telling you what July "means." None of this is investment advice.