Trade Desk, Inc. (TTD)
NasdaqGM · Price as of · Delayed Quote
- Profitability20/20
Profitable and growing: $478.3M net income over the last four reported quarters, up from $438.6M the year before.
- Insider buying vs selling11/20
Insiders are sellers only: 1 sell worth $1.1M, no open-market buys, across the last 20 Form 4s. Routine executive selling is common, so this is only a mild negative. Separately, 3 new 5%+ stake disclosures (13D/13G) hit in the last 6 months, which is big-money accumulation.
- Dilution and offerings4/15
1 offering-related filing in the last year (share-count history unavailable).
- Analysts30
- Implied upside+7.9%
- Target range$9.00 to $21.00
- EPS expected$0.25 -44%
- A year ago$0.45
- Revenue expected$651.4M -12%
- Estimate range$0.21 to $0.35
TTD closed at $12.63 on Sep 24, down 4.7% since Aug 25. Chart read: price below both the 50-day and 200-day moving averages; the 50-day is below the 200-day (downtrend structure); trading at 0% of the 52-week range ($12.60 to $54.13).
How Congress has done in TTD
Every purchase of TTD disclosed by a member of Congress in the last 5 years, scored over the 12 months after the trade date against SPY over the same window.
| Measure | TTD | SPY |
|---|---|---|
| Median 12-month return after purchase | -59.6% | +18.2% |
| Median difference vs SPY | -75.9% | — |
| Purchases that beat SPY | 3 of 10 (30%) | — |
| Members who bought | 6 | — |
Most frequent buyers: Jefferson Shreve (2), Josh Gottheimer (2), Lisa McClain (2), Rob Bresnahan (2), Byron Donalds (1).
These are not returns anyone actually earned. Disclosures report a dollar bracket and no share count, so every purchase is counted once and weighted equally, and sales are not matched back to the buys that opened them. 3 of the 10 purchases are disclosed as a spouse's or dependent's rather than the member's own. Purchases from the last 12 months are excluded because their window has not closed yet.
Congress trades in TTD
| Date | Member | Action | Amount | |
|---|---|---|---|---|
| 2026-08-18 | Gil Cisneros CA | Purchase | $1,001 - $15,000 | |
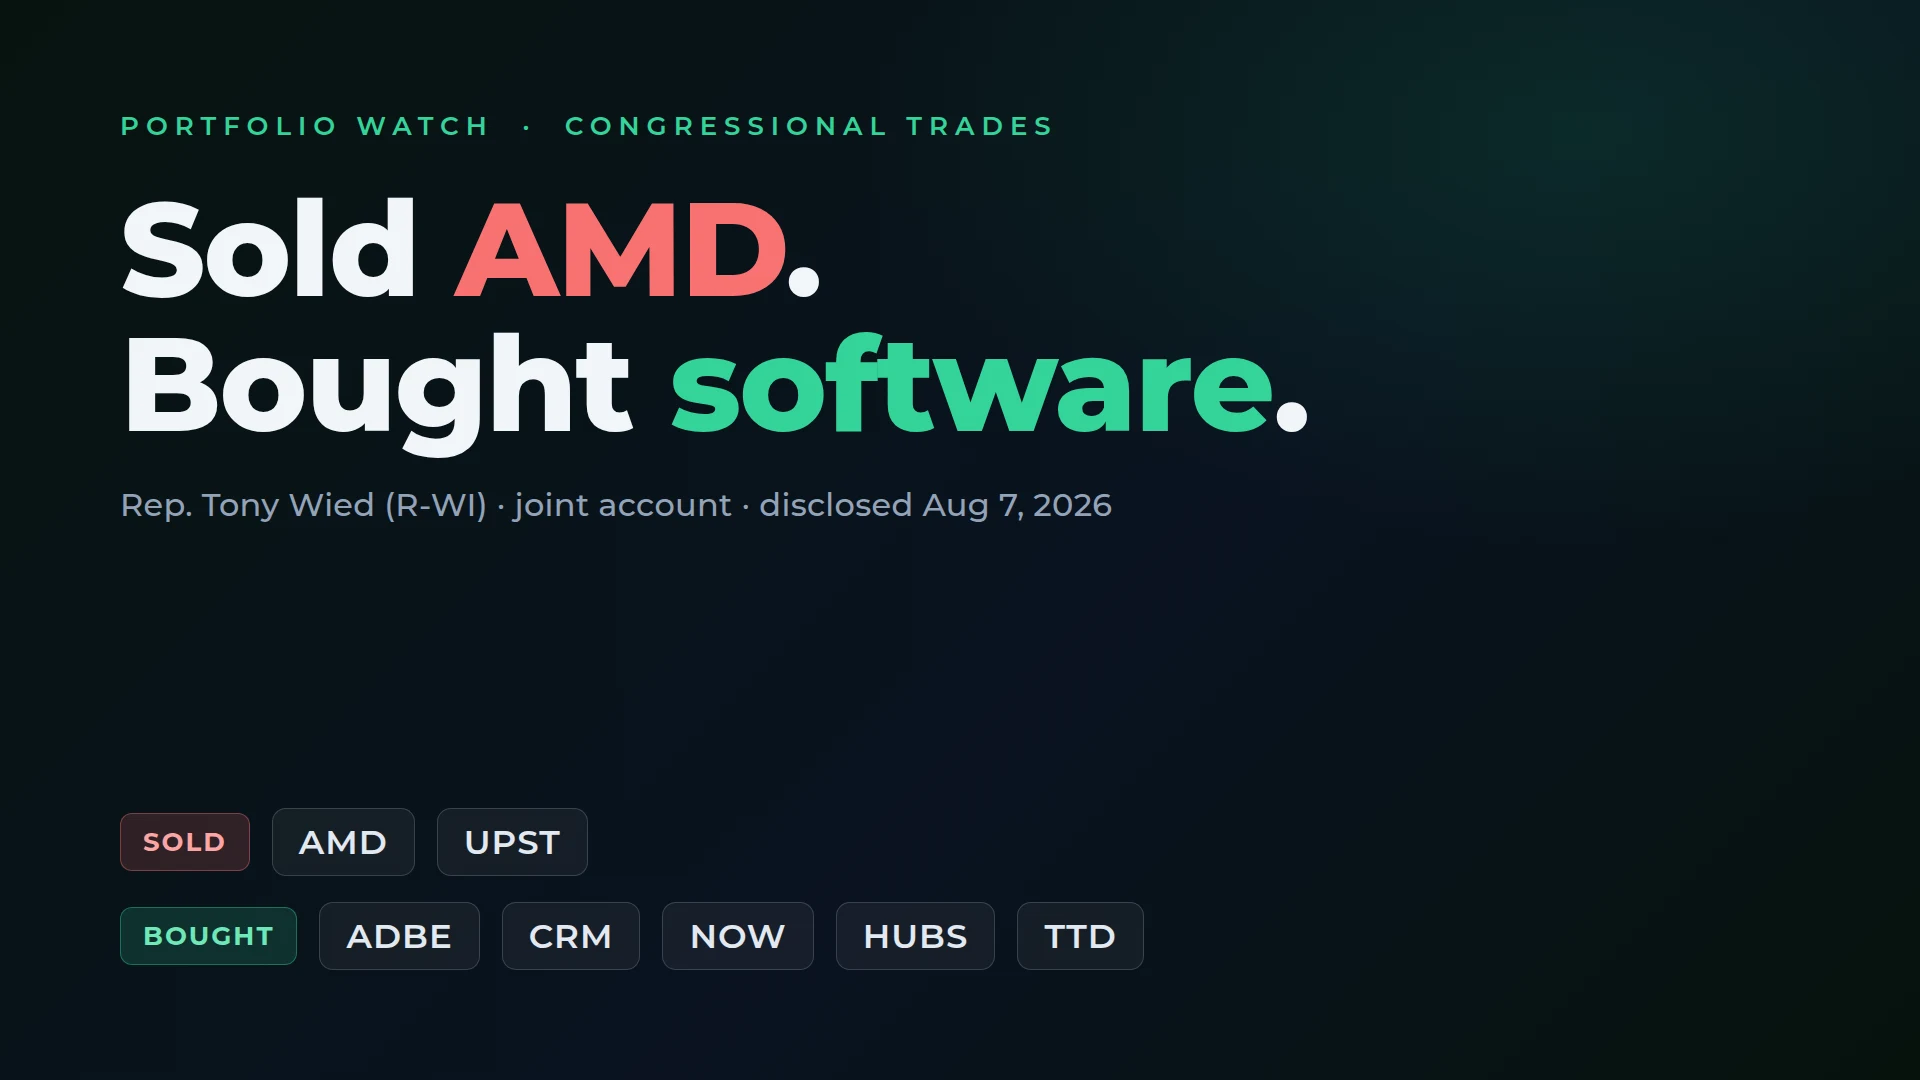
| 2026-08-14 | Tony Wied WI | Sale | $15,001 - $50,000 | |
| 2026-07-17 | Gil Cisneros CA | Purchase | $1,001 - $15,000 | |
| 2026-07-16 | Gil Cisneros CA | Purchase | $1,001 - $15,000 | |
| 2026-06-16 | Gil Cisneros CA | Sale | $1,001 - $15,000 |
SEC filings
| Form | Filed | Description |
|---|---|---|
| DEF 14A | September 18, 2026 | DEF 14A |
| 4 | September 16, 2026 | FORM 4 |
| 8-K | September 15, 2026 | 8-K |
| 4 | September 14, 2026 | FORM 4 |
| 4 | September 14, 2026 | FORM 4 |
| 4 | September 14, 2026 | FORM 4 |
| 4 | September 14, 2026 | FORM 4 |
| PRE 14A | September 8, 2026 | PRE 14A |
Trade Desk news

Articles that mention Trade Desk without it being the main subject.
Frequently asked questions
When does TTD report earnings?
Trade Desk, Inc. (TTD) is scheduled to report quarterly results on November 5, 2026 (estimated). The 17-analyst consensus is $0.25 per share on revenue of $651.4M for the quarter ending September 30, 2026, against $0.45 and $739.4M a year earlier. It has beaten the consensus EPS estimate in 2 of the last four quarters. The date is an estimate from past reporting patterns and can move until the company confirms it.
What do analysts expect for TTD?
30 analysts cover Trade Desk, Inc. (TTD). The consensus rating is Hold. The average price target is $13.60, in a range of $9.00 to $21.00.
Are insiders buying or selling TTD?
We have no qualifying Form 4 insider purchases or sales on record for Trade Desk, Inc. (TTD). Sales are only tracked above a dollar threshold, so small routine trades may not appear.
Has Congress made money trading TTD?
6 members of Congress have disclosed buying TTD in the last 5 years, 10 purchases in total. Measured over the 12 months after each trade date, the median purchase returned -59.6% against +18.2% for SPY over the same windows, and 3 of the 10 (30%) beat the index. These are not returns anyone actually earned: congressional disclosures report a dollar bracket and no share count, so each purchase is counted once and weighted equally, and later sales are not matched back to the buys that opened them.
Where can I see TTD SEC filings?
Recent filings are listed on this page, newest first. The latest is a DEF 14A filed September 18, 2026.