Key points
- The Nasdaq was higher six months after 23 of 31 corrections
- Thirteen of the Nasdaq's 31 cases became bear markets within a year
- The Nasdaq entered its second correction of 2026
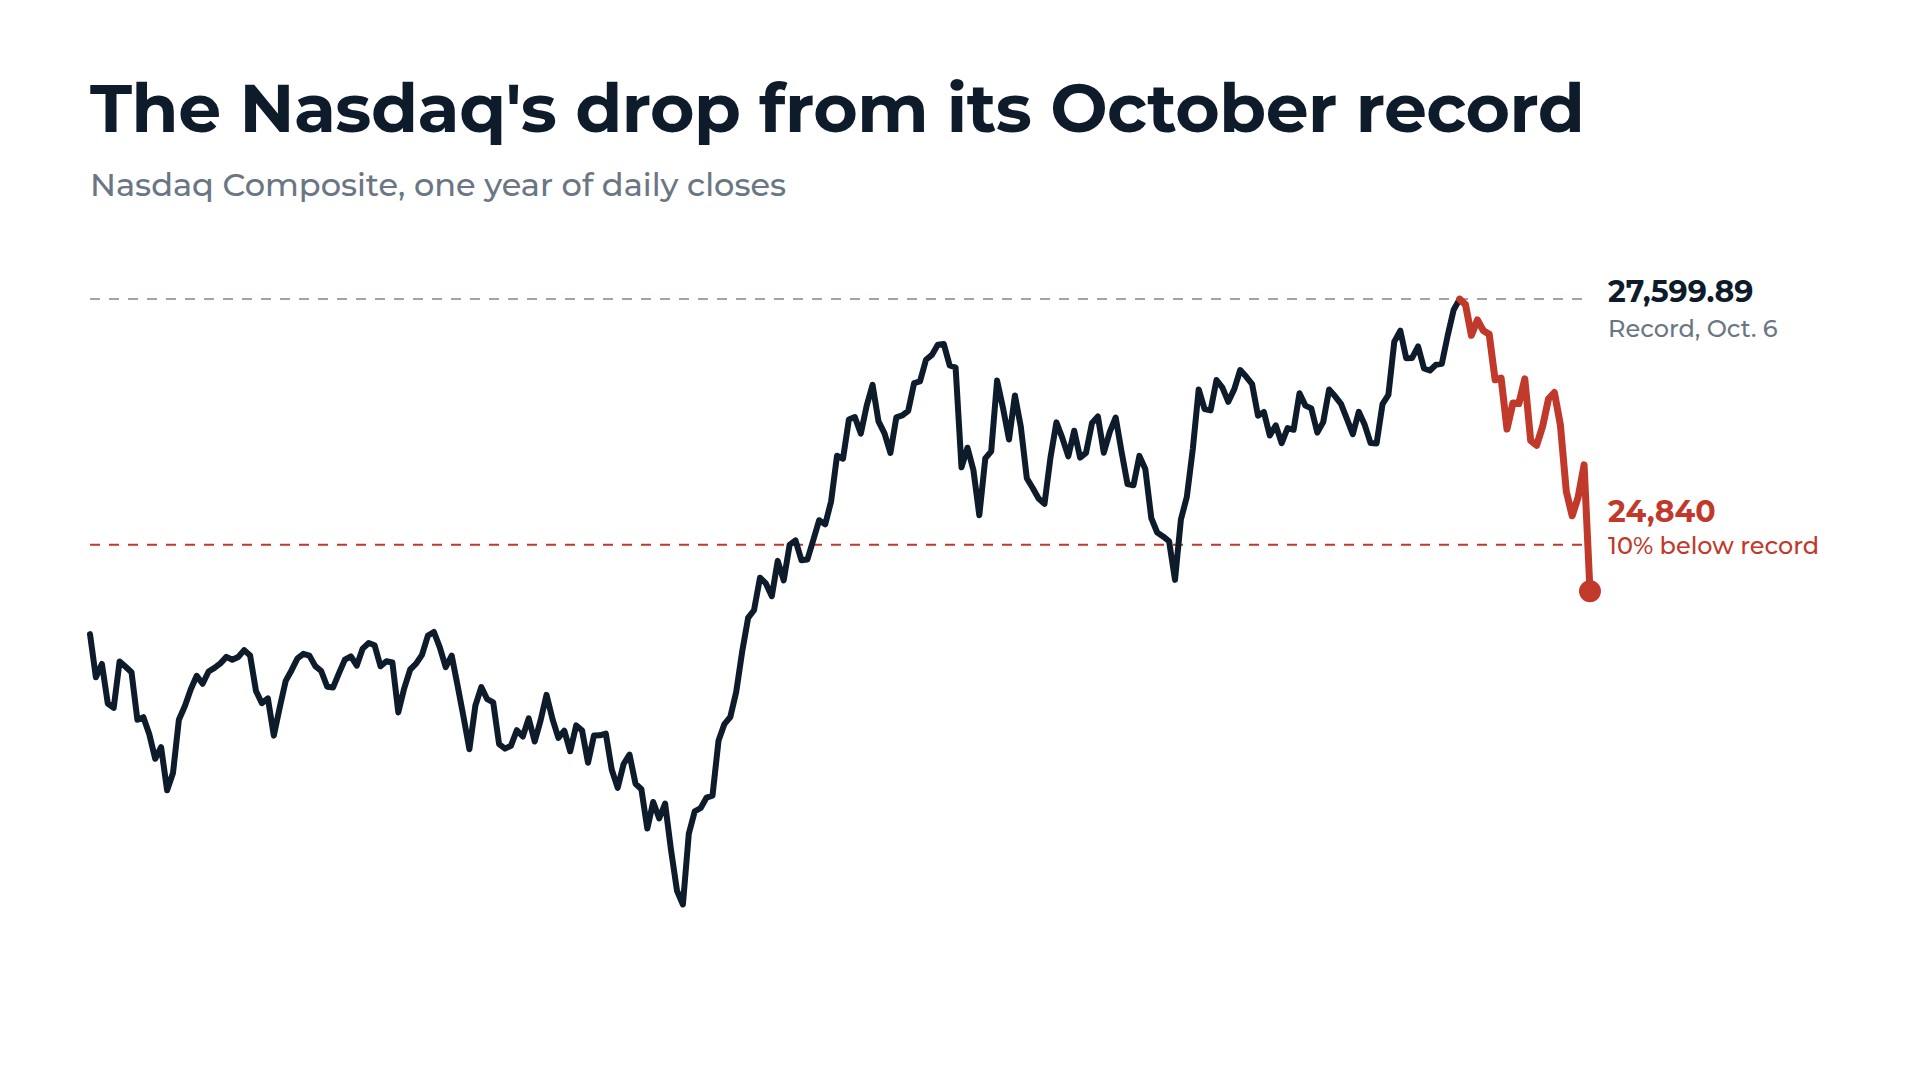
The Nasdaq Composite entered a correction on November 5, its second this year. The index closed at 24,315, down 5.5% on the day and 11.9% below its October 6 record close of 27,599.89.
A correction is generally a decline of at least 10% from a recent high. For the Nasdaq, that level was about 24,840.
I went through Nasdaq closes back to 1971 to see what happened after earlier drops from record highs. I found 31 cases where the index first closed at least 10% below a record. It was higher six months later in 23 of them, with a median gain of 18.2%. But 13 of the 31 became bear markets within a year, before the index set another record.
What happened after 31 corrections from record closes
This isn't a count of every 10% decline. Once a correction began, I didn't count another until the Nasdaq had set a new record close.
| Time after correction | Median change | Higher in | Worst | Best |
|---|---|---|---|---|
| 1 month | +2.1% | 19 of 31 | -20.6% | +16.3% |
| 3 months | +5.1% | 20 of 31 | -16.2% | +23.2% |
| 6 months | +18.2% | 23 of 31 | -16.2% | +60.4% |
| 12 months | +21.9% | 23 of 30 | -58.7% | +96.6% |
The one-month results had the lowest median and the fewest gains in the table. The index was higher one month later in 19 of 31 cases, and the worst result was the 20.6% drop that followed October 16, 1987, the session before Black Monday.
The 12-month range covers the dot-com bubble from both sides. The best result was a 96.6% gain after February 17, 1999. The worst was a 58.7% drop after March 30, 2000.
The most recent case went well. The Nasdaq entered a correction on March 26, set a new record on April 15, and stood 16.3% higher after one month and 26.4% higher after six months. It set the current record on October 6.
How many corrections became bear markets?
A bear market is commonly defined as a drop of at least 20% from a record close. For the Nasdaq today, a bear market would mean a close near 22,080. In 13 of the 31 historical cases, the index closed at least 20% below its previous record within a year and before setting a new one. That includes four of the last 10: 2018, 2020, 2022, and 2025.
Getting back to a record took a median of 80 trading days from the correction, and 24 of the 31 cases got there within a year. The outlier was 2000. The Nasdaq needed 3,788 trading days, or about 15 years.
Why the Nasdaq fell
Reuters tied the drop to worries over AI spending and closer scrutiny of data center expansion after Democrats won both chambers of Congress. We reported on the Texas and Georgia governors' races after the election. "When it looked like the Democrats were going to take significant majorities in both the House and the Senate, we thought that at the very least, it would lead to markets taking a little bit of a pause," said Sameer Samana, senior global market strategist at Wells Fargo Investment Institute.
Chip stocks took the worst of it. Micron (MU) closed down 17.5%, AMD (AMD) 17.3%, and Nvidia (NVDA) 9.3%. The VanEck Semiconductor ETF (SMH) fell 11.2% and closed about 33% below its June 22 record close, by our calculations. Tesla (TSLA) fell 10.8%.
The selling didn't start this week. Chip stocks fell for eight straight days in October, and Reuters said the Nasdaq lost more than $2.5 trillion in market value that month.
How I read these numbers
I don't read this table as a signal to buy. The Nasdaq was higher a month later in most cases, but the 1973, 2000, and 2022 bear markets all began with a 10% decline too.
The longer view was more often favorable: the index reached a new record within a year in 24 of the 31 cases. The other seven took longer.
How we counted: We count a correction at the first close at least 10% below the previous record close. The count resets when the Nasdaq sets a new record. Returns are measured from the correction close, using 21, 63, 126, and 252 trading days for one, three, six, and 12 months.
We count a bear market if the Nasdaq closed at least 20% below the previous record within 252 trading days of the correction and before setting another record. Daily closes come from Yahoo Finance beginning February 5, 1971; we checked them against Nasdaq's series back to October 1984. The October 6 record close comes from Nasdaq.
There are no new cases between 2000 and 2015 because the index didn't set another record during that period. The sample therefore consists of 21 cases from 1971 to 2000 and 10 from 2015 to 2026. Most predate the current scale of index funds and AI spending. The 12-month column excludes the March 2026 case, which hasn't reached 12 months. That case still counts in the bear market and recovery figures because the index set a new record on April 15, which settled both outcomes.