Key points
- The S&P 500 was higher six months after 18 of 26 corrections
- Twelve of the S&P 500's 26 corrections became bear markets within a year, before a new record
- The Dow also closed in a correction, its second of 2026
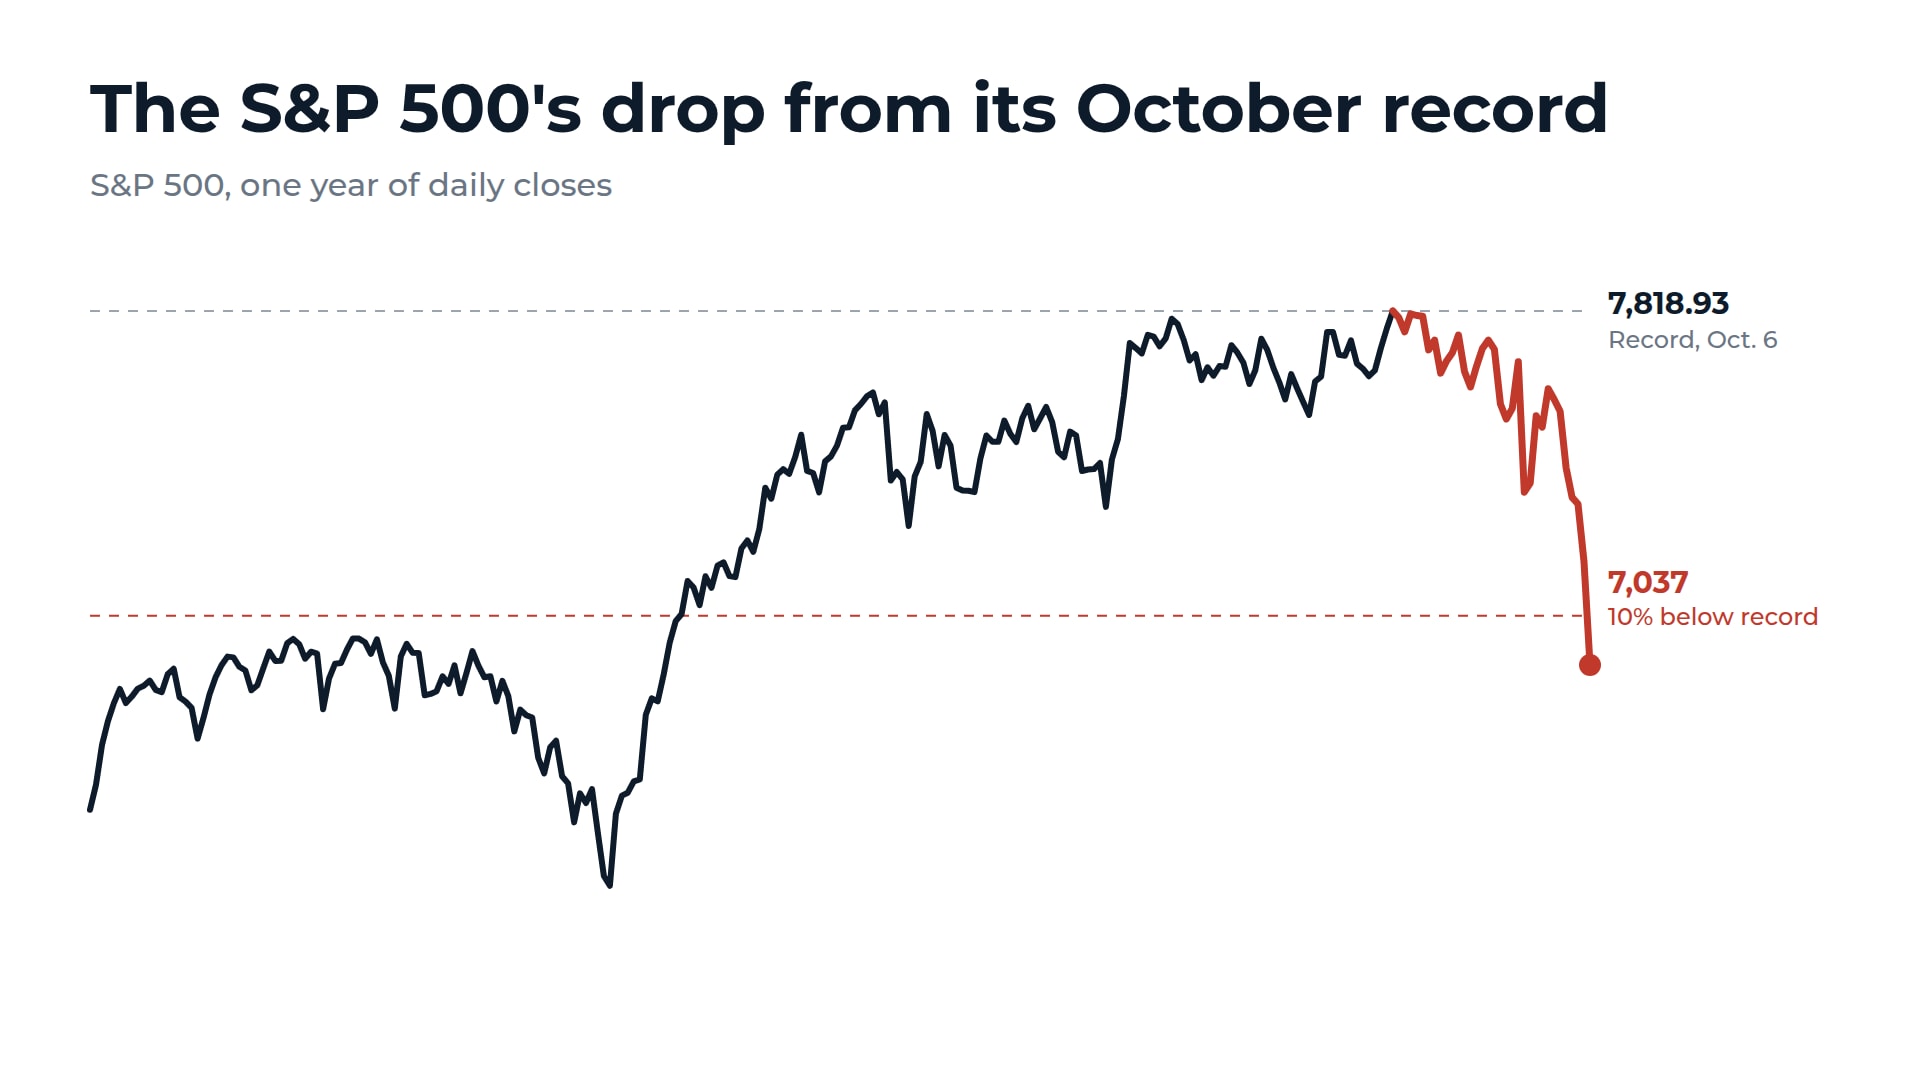
The S&P 500 entered a correction on Nov. 20, closing 11.6% below its October record. History offers investors a mixed picture of what could come next.
I went through S&P 500 closes back to 1928 and found 26 earlier corrections from record highs, counting a new one only after the index had set another record. The index was higher six months later in 18 of them, with a median gain of 5.7%. But 12 of the 26 became bear markets within 252 trading days, or about a year, before the index reached another record.
The S&P 500 fell 3.7% on Nov. 20 to close at 6,910.39. Its record close was 7,818.93 on Oct. 6, and it had closed 8.2% below that level on Nov. 19. A correction is generally a decline of at least 10% from a recent high, which for the S&P 500 was about 7,037.
What happened after 26 S&P 500 corrections
I counted a correction on the first close at least 10% below a record close. This isn't a count of every 10% decline.
| Time after correction | Median change | Higher in | Worst | Best |
|---|---|---|---|---|
| 1 month | +2.1% | 16 of 26 | -28.1% | +9.6% |
| 3 months | +2.5% | 16 of 26 | -24.5% | +15.4% |
| 6 months | +5.7% | 18 of 26 | -16.4% | +24.8% |
| 12 months | +11.4% | 17 of 26 | -39.5% | +41.4% |
Source: Yahoo Finance daily S&P 500 closes since 1928, with cases since 2016 checked against Federal Reserve Bank of St. Louis data. Changes are measured from the close on the day of the correction.
The worst result in the table came after Oct. 4, 1929, three weeks before the crash. The S&P 500's predecessor index fell another 28.1% in the next month. The worst 12-month result was a 39.5% drop after Nov. 26, 2007, which ran into the 2008 financial crisis.
The most recent case had a rough start. The S&P 500 entered a correction on March 13, 2025, and fell another 2.9% in the next month during the April tariff selloff. It was 19.2% higher after six months and set a new record on June 27, 2025.
When the Nasdaq entered a correction on Nov. 5, I ran the same count on its history. The median six-month gain across its 31 earlier cases was 18.2%, compared with 5.7% for the S&P 500 here. The two samples cover different periods, so the figures aren't a like-for-like comparison.
Twelve of the 26 corrections became bear markets
A bear market is commonly defined as a drop of at least 20% from a record close. For the S&P 500 today, that line is about 6,255. In 12 of the 26 earlier cases, the index closed at least 20% below its record within 252 trading days of the correction and before setting a new one. That includes four of the last 10: 2000, 2007, 2020, and 2022.
The bear market count and the six-month returns measure different things, so the two groups overlap. The corrections that began in 1956, 1973, 2000, and 2020 were higher six months later and still became bear markets.
Several cases came close without crossing. The S&P 500 bottomed 19.9% below its record in 1990, 19.3% below in 1998, 19.8% below in 2018, and 18.9% below in April 2025.
In six of the 26 cases, the day the S&P 500 entered a correction was also its lowest close before the next record. The most recent was Feb. 8, 2018.
Getting back to a record took a median of 224 trading days, and 16 of the 26 cases got there within 252 trading days. Four took more than five calendar years. After the 1929 correction, the index didn't set a new record until September 1954, about 25 years later. After the corrections that began in 1973, 2000, and 2007, it took about seven, seven, and five years.
All 26 S&P 500 corrections since 1928
| Correction date | Six months later | Became a bear market | Trading days to a new record |
|---|---|---|---|
| June 12, 1928 | +22.8% | No | 54 |
| Oct. 4, 1929 | -9.7% | Yes | 6,235 |
| Oct. 11, 1955 | +17.7% | No | 23 |
| Nov. 21, 1956 | +5.7% | Yes | 463 |
| March 4, 1960 | +4.6% | No | 227 |
| April 30, 1962 | -16.4% | Yes | 339 |
| May 16, 1966 | -3.6% | Yes | 244 |
| March 5, 1968 | +17.0% | No | 37 |
| June 19, 1969 | -6.8% | Yes | 686 |
| April 27, 1973 | +3.0% | Yes | 1,825 |
| Aug. 24, 1981 | -11.1% | Yes | 303 |
| Feb. 13, 1984 | +6.8% | No | 237 |
| Oct. 15, 1987 | -12.9% | Yes | 449 |
| Jan. 30, 1990 | +10.3% | No | 82 |
| Aug. 17, 1990 | +12.6% | No | 124 |
| Oct. 27, 1997 | +24.8% | No | 28 |
| Aug. 14, 1998 | +16.9% | No | 70 |
| Sept. 29, 1999 | +18.9% | No | 34 |
| April 14, 2000 | +1.3% | Yes | 1,788 |
| Nov. 26, 2007 | -1.2% | Yes | 1,343 |
| Aug. 24, 2015 | +1.9% | No | 221 |
| Feb. 8, 2018 | +10.6% | No | 137 |
| Nov. 23, 2018 | +5.7% | No | 101 |
| Feb. 27, 2020 | +16.8% | Yes | 120 |
| Feb. 22, 2022 | -4.1% | Yes | 479 |
| March 13, 2025 | +19.2% | No | 73 |
Source: Yahoo Finance daily S&P 500 closes. "Became a bear market" means a close at least 20% below the record within 252 trading days of the correction and before a new record.
How I read these numbers
I don't read these tables as a signal to buy. They're a historical record, not the odds for this correction.
The Dow and chip stocks also fell on Nov. 20
The Dow Jones Industrial Average also closed in a correction. The Dow fell 1.9% to 48,147.33, which is 11.4% below its Aug. 5 record close of 54,349.12. It was the Dow's second correction this year, after one in March.
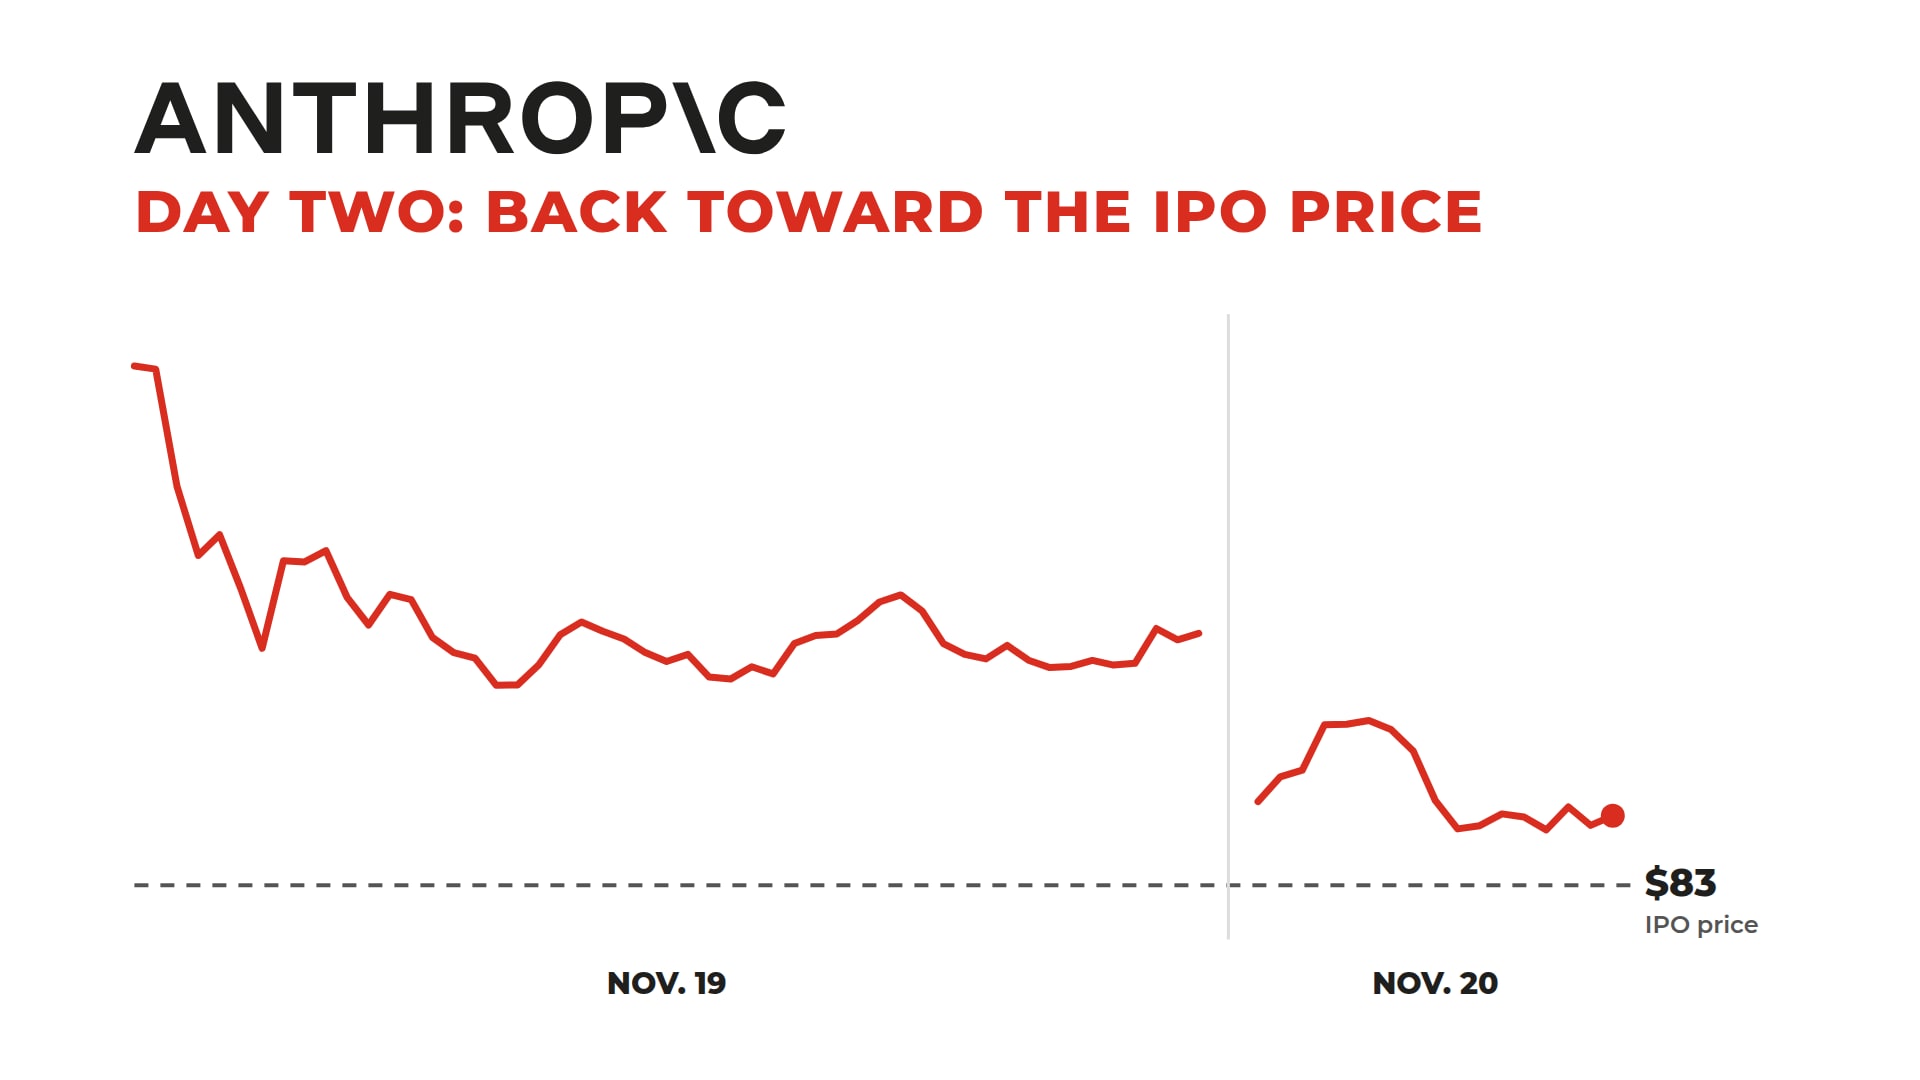
Chip stocks fell hardest. Nvidia (NVDA) fell 14.0%, its worst day since January 2025, after Reuters reported that the Securities and Exchange Commission is examining potential accounting issues at the company. Nvidia is now fourth in the world by market value. Anthropic (ANT) fell 8.5% on its second day of trading.
The Nasdaq Composite fell 5.3%, and the Nasdaq 100 fell 5.6% to close 19.8% below its Oct. 6 record, just short of a bear market. The S&P 500 fell 8.6% for the week, its worst week since the week ending April 4, 2025. It took 33 trading days to go from the Oct. 6 record to a correction. Even after the drop, the index is up 0.9% for 2026.
How we counted: We count a correction at the first close at least 10% below the previous record close. The count resets when the S&P 500 sets a new record. Returns are measured from the correction close, using 21, 63, 126, and 252 trading days for one, three, six, and 12 months. We count a bear market if the index closed at least 20% below the previous record within 252 trading days of the correction and before setting another record. Recovery times longer than that are given in calendar years.
There are no cases between 1929 and 1955 or between 2000 and 2007 because the index didn't set a new record in those periods. Before March 1957, the S&P index tracked 90 stocks instead of 500. Daily closes come from Yahoo Finance beginning Jan. 3, 1928. We checked the five cases since 2016 and the Oct. 6 record close against Federal Reserve Bank of St. Louis data, and the Nov. 20 closes against CNBC.