Key points
- Why Fed policy matters for AI financing
- What a quarter-point move does to our AI Bubble Index
- How stocks did on 52 hike days since 1994
- What I'll watch on October 28
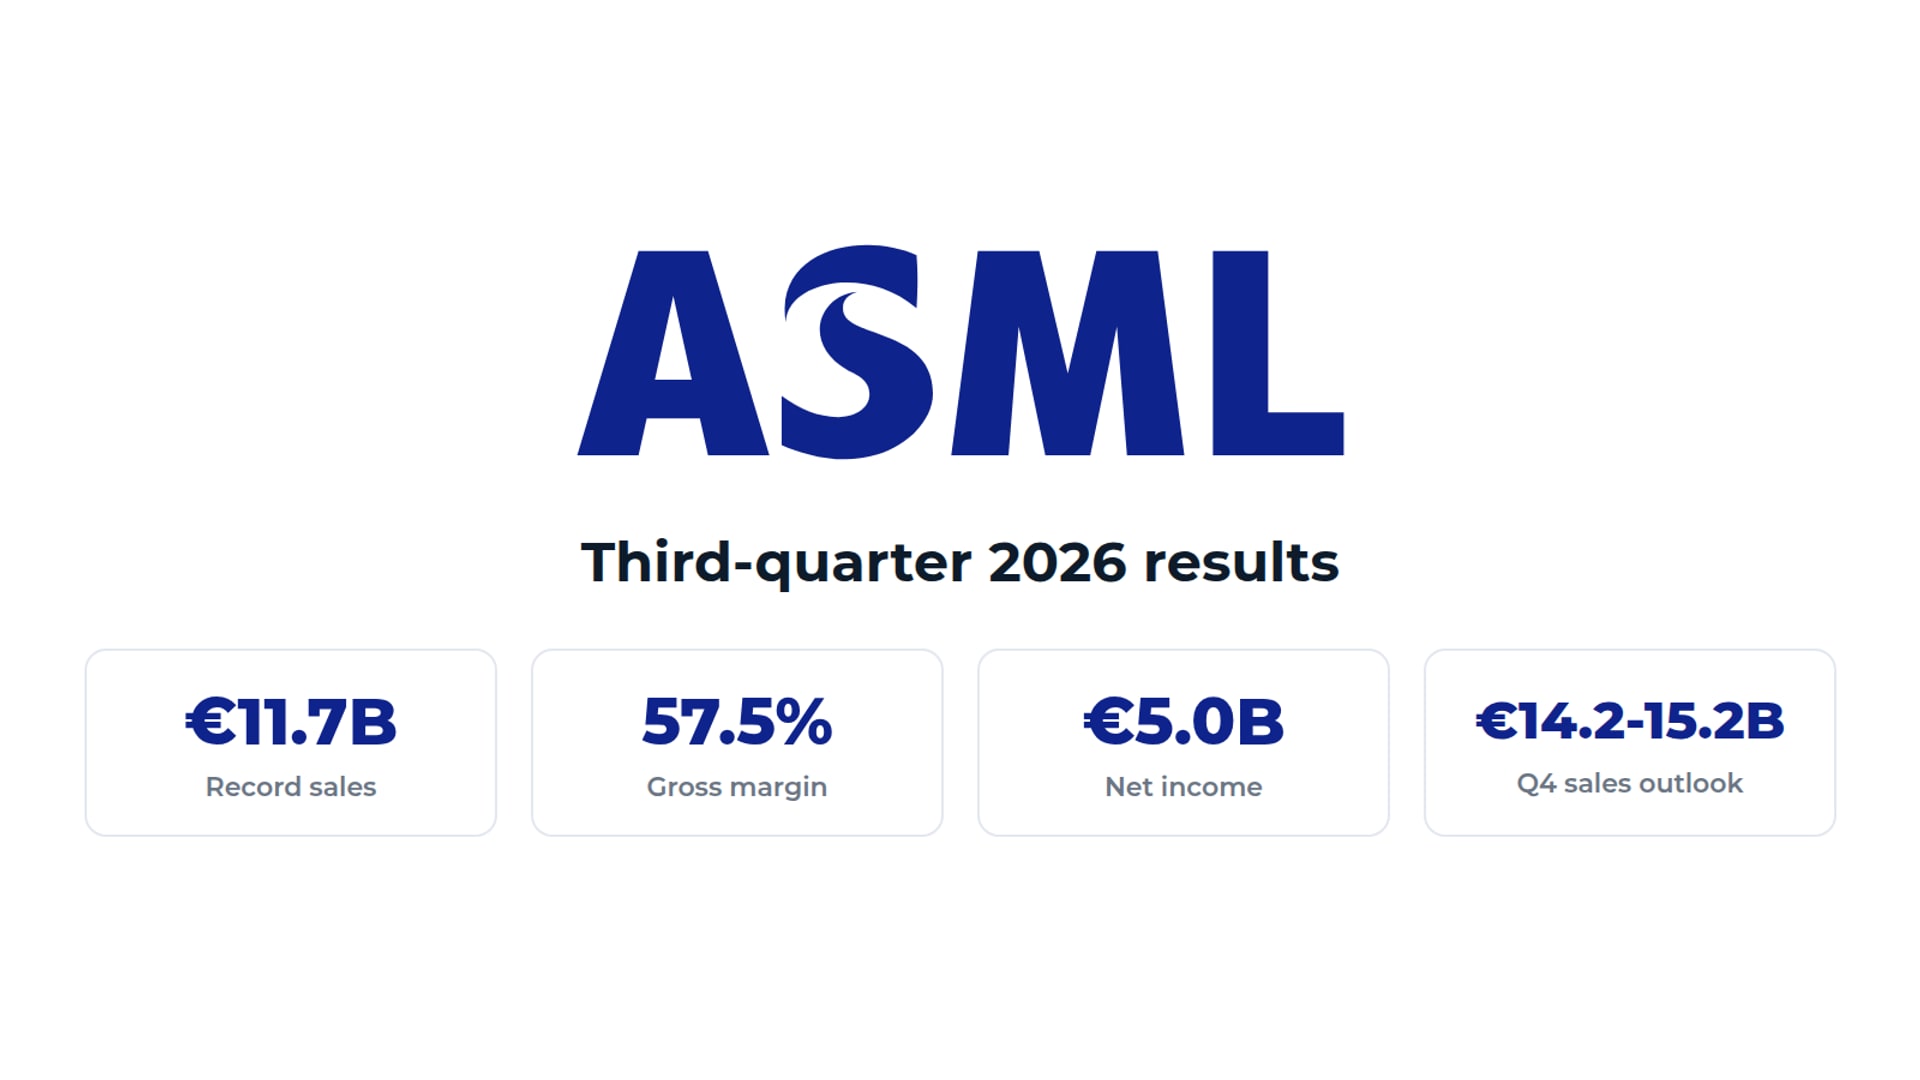
The AI buildout needs financing as well as chips. Suppliers are offering loans and guarantees to their own customers, SoftBank is borrowing at junk-bond rates to fund OpenAI, and chip executives warn that capital could become the next bottleneck. That makes the Fed’s interest-rate path a practical concern for the companies funding the expansion.
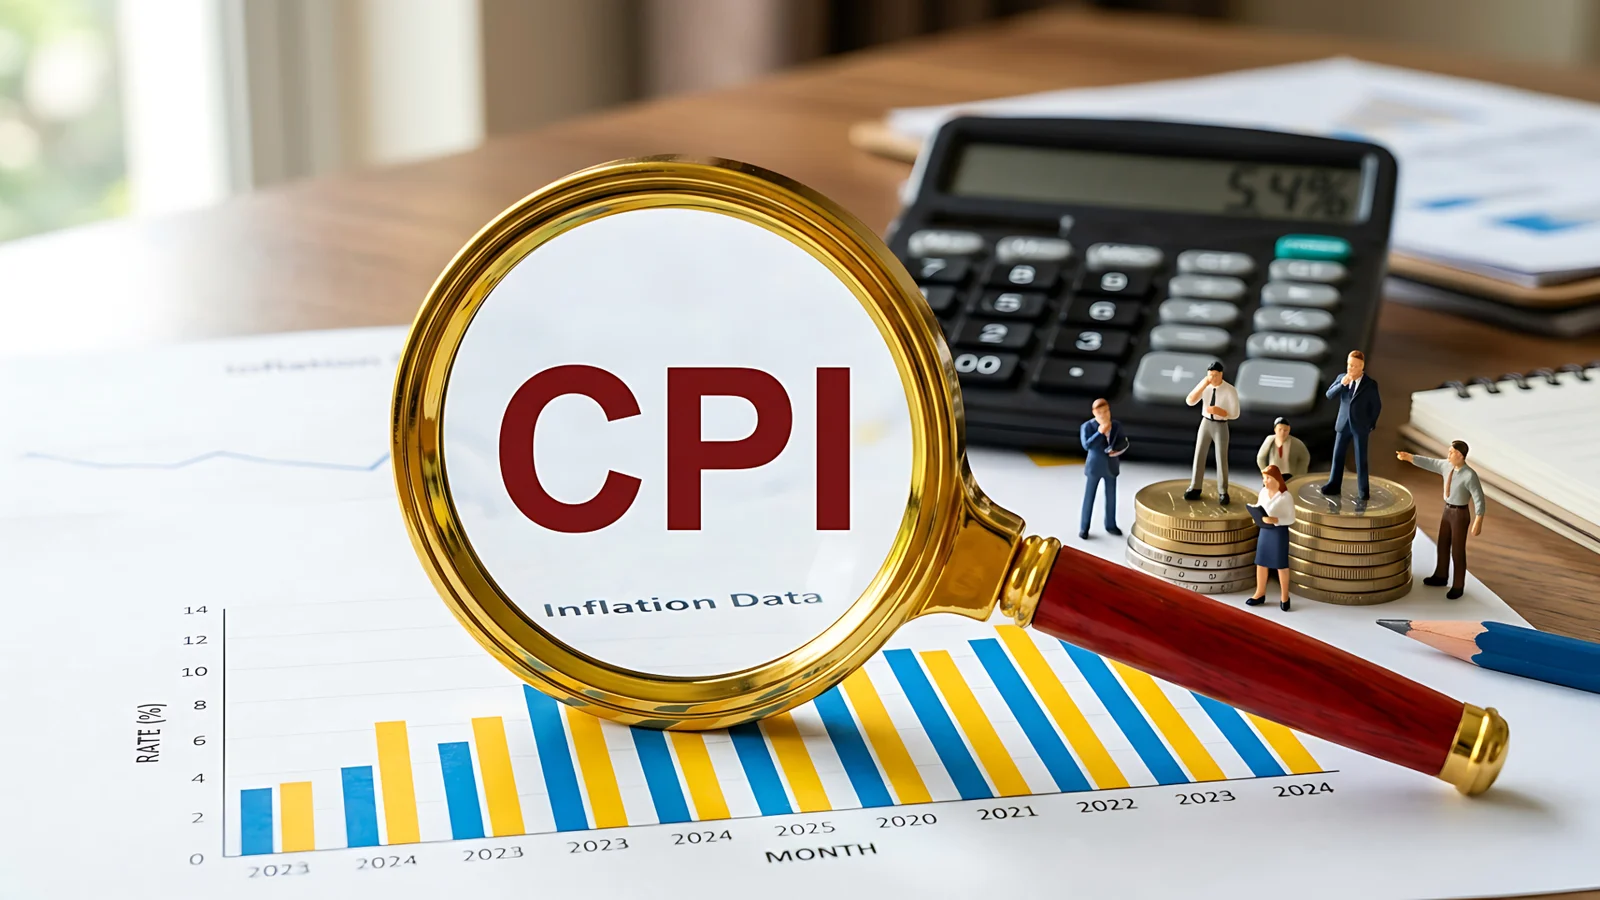
Wednesday’s inflation report added to that concern. Consumer prices rose 0.6% in September and 3.7% from a year earlier, the Bureau of Labor Statistics reported on October 14. Core prices, excluding food and energy, rose 0.3% for the month. Both the annual headline figure and monthly core increase exceeded economists’ forecasts of 3.6% and 0.2%, respectively, InvestmentNews reported.
Hike odds jumped, then gave back most of it. The same report cited CME FedWatch odds of 51.5% for an October 28 hike shortly after the release Wednesday morning. By 3:58 p.m. ET, CME's tool showed 32.7%, against 22.1% on Tuesday, and a hold was back to the favorite at 67.3%.
Stocks didn't bounce with the odds. The Nasdaq Composite closed down 1.88% at 26,692.87, and the S&P 500 fell 1.11% to 7,718.94. The 2-year Treasury yield rose to 4.82% from 4.79%, while the 10-year slipped to 5.19% from 5.21%, according to Treasury data.
Financing is becoming part of the AI bet
Two days before the inflation release, Broadcom (AVGO) CEO Hock Tan said capital might become the buildout’s biggest constraint. Intel CEO Lip-Bu Tan, speaking at the same conference, put it in terms of price. “If there’s any challenge in the front, it’s capital and the cost of capital,” he said.
Some of that money comes from the chipmakers themselves, through loans, guarantees, and lease backstops for their own customers. Our AI Bubble Index tracks those commitments as one of its nine readings.
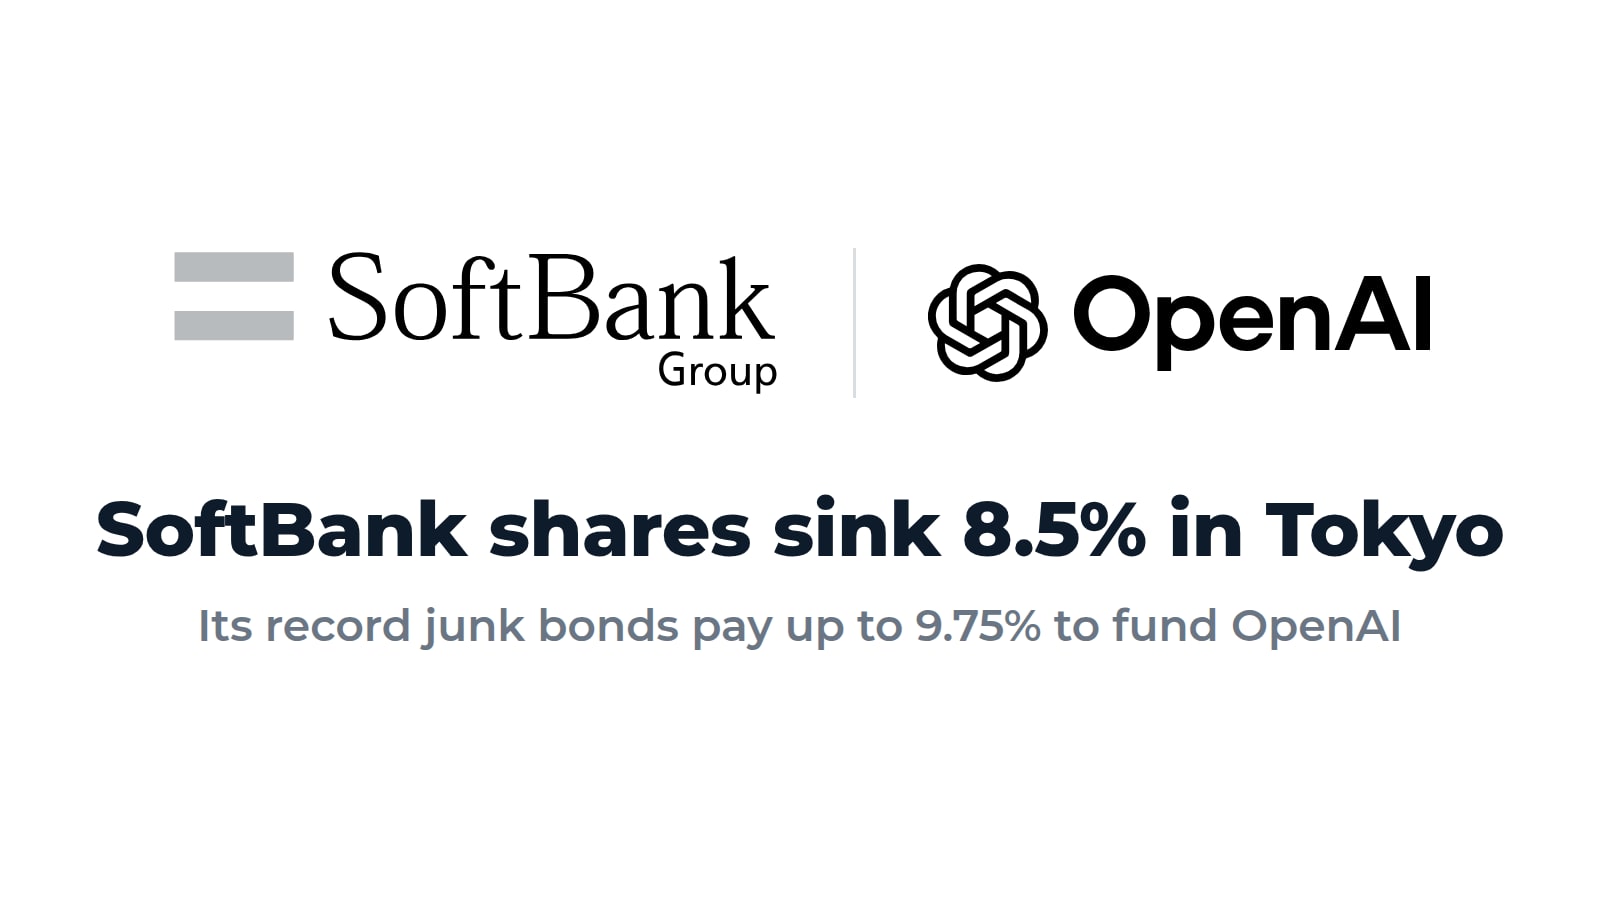
The financing extends beyond suppliers. SoftBank sold bonds last month with annual coupons as high as 9.75% to fund its OpenAI investment, as we reported Tuesday. Those coupons are fixed, but higher market rates can make future borrowing and refinancing more expensive. For the AI buildout, the question is whether the returns arrive fast enough to cover that cost.
What a quarter point does to our index
The index's cost-of-money component averages three sub-scores: the 12-month change in the 10-year Treasury yield, private credit funds' prices, and AI borrowers' bond spreads. The index's Wednesday reading used Tuesday's 10-year yield, a 116-basis-point rise over 12 months, and stood at 61. At that level, and holding the other inputs constant, every extra 25 basis points on the 10-year adds about 8 points to the 10-year sub-score. Because cost of money averages three sub-scores, that's about 2.7 points on the cost-of-money component. Cost of money carries 11.5% of the full index, so it works out to about 0.3 points on the index.
The catch is that a Fed hike doesn't move the 10-year one for one. On the September 16 hike day, the 2-year yield rose 7 basis points while the 10-year rose 1, we reported at the time. The hike lands mostly on short-term rates, which matter for floating-rate loans. Longer-term yields and spreads, which set bond coupons like SoftBank's, move more on the inflation outlook and on what the Fed signals next.
Hike days are bigger days, but not reliably down days
My first thought this morning was that stocks are pricing in the inflation and the rate hike right now, so the actual hike shouldn't hurt much. As it turned out, futures never priced it as a sure thing, and the reported morning snapshot put the odds near a coin flip. I went back and checked every Fed rate increase since 1994. There have been 52.
The S&P 500 rose on 23 of those announcement days and fell on 29. The average move was a gain of 0.18%, and the median was basically flat at -0.03%. The S&P moved at least 1% either way on 18 of the 52 days, about 35%. On all trading days since 1994, it's 26.5%. So in this sample, hike days tend to be bigger days, and 12 of those 18 big moves were gains.
The day after is where it gets interesting. The S&P 500 went the opposite way the day after 31 of the 52 hikes, about 60% of the time, against a little more than half of ordinary days since 1994. That doesn't mean the next day erased the first move, and the next-day moves weren't bigger on average. Fifty-two days is also a small sample. Last month's hike was one of the reversals. The table below shows it alongside two 2022 hikes where the next day kept going the same way.
| Fed decision | What happened | S&P 500 that day | S&P 500 next day | QQQ that day | QQQ next day |
|---|---|---|---|---|---|
| March 16, 2022 | First hike in over three years, fully expected | +2.24% | +1.23% | +3.71% | +1.21% |
| September 21, 2022 | Expected 0.75-point hike, plus signals of more to come | -1.71% | -0.84% | -1.79% | -1.23% |
| September 16, 2026 | Quarter-point hike, first since July 2023 | -0.45% | +1.14% | +0.03% | +1.73% |
Source: Federal Reserve rate history; S&P 500 and Invesco QQQ Trust (QQQ) daily closes via Yahoo Finance. QQQ tracks the Nasdaq 100. Since 2015, the Fed's table lists the effective date, the day after the announcement, so returns use the announcement day.
The 52 days don't sort into expected and surprise hikes, since that would need futures pricing for each one. Daily returns also can't isolate the Fed's effect from other news that day.
October now leans toward a hold
At 32.7% shortly before the close, futures lean toward a hold. That makes a hike on October 28 the bigger surprise compared with where pricing sits now, though Wednesday showed how fast the odds can move.
"September's print was likely not sufficient for the Fed to execute back-to-back increases at the October FOMC meeting," said Jeff Schulze, head investment strategist at Franklin Templeton Institute. Jeffrey Roach, chief economist at LPL Financial, saw it the other way. "Inflation pressures are broadening beyond energy," he said.
I'll watch where those odds sit on October 28. If they stay near a third, a hike is the bigger surprise. If they climb toward certainty, attention shifts to Fed Chair Kevin Warsh's guidance. Neither guarantees how far stocks will move. For AI borrowers, the path Warsh signals could matter as much as the decision itself.
Today's selloff looks like investors adjusting to hotter inflation, but nothing says they're done adjusting.