Key points
- Nvidia has fallen seven straight weeks only once before, in 2008
- What Nvidia did after 12 earlier losing streaks of five weeks or more
- How Nvidia's 46% seven-week drop compares with its 2008 streak
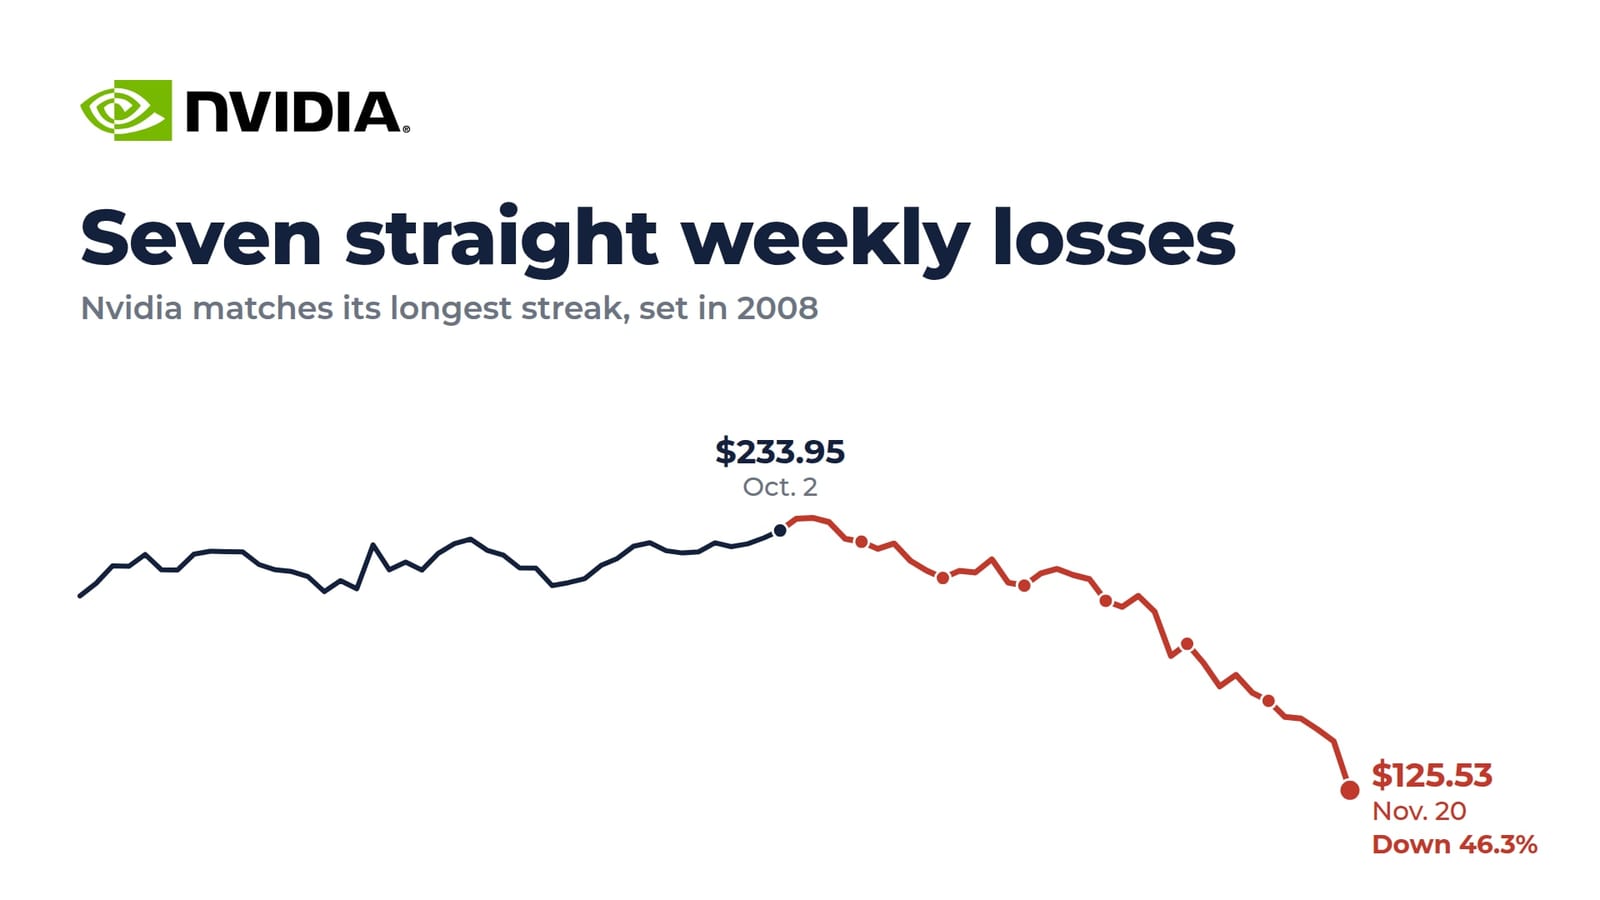
Nvidia (NVDA) has fallen for seven straight weeks, matching the longest weekly losing streak since its 1999 initial public offering. The only other seven-week streak ended in July 2008.
Nvidia closed at $125.53 on Nov. 20, down 22.9% for the week. The stock is 46.3% below its Oct. 2 close of $233.95, the last weekly close before the streak began, and 47.5% below its record close of $239.24 on Oct. 6. Nvidia is down 32.7% for 2026.
I went through Nvidia's weekly closes back to January 1999. Twelve earlier losing streaks lasted at least five weeks. Eight of them ended at five weeks, three ended at six, and one reached seven. None reached eight.
Each of Nvidia's last four weekly losses was larger than the one before
| Week ended | Nvidia close | Weekly change |
|---|---|---|
| Oct. 2 | $233.95 | Last close before the streak |
| Oct. 9 | $229.28 | -2.0% |
| Oct. 16 | $214.13 | -6.6% |
| Oct. 23 | $210.96 | -1.5% |
| Oct. 30 | $204.64 | -3.0% |
| Nov. 6 | $186.64 | -8.8% |
| Nov. 13 | $162.85 | -12.7% |
| Nov. 20 | $125.53 | -22.9% |
Source: Nasdaq closing prices for 2026.
The 22.9% loss in the week ended Nov. 20 was Nvidia's largest weekly decline since the week ended Oct. 10, 2008. Nvidia last fell this much over seven weeks in 2018, when the stock dropped 50.0% between its Oct. 1 and Nov. 19 closes.
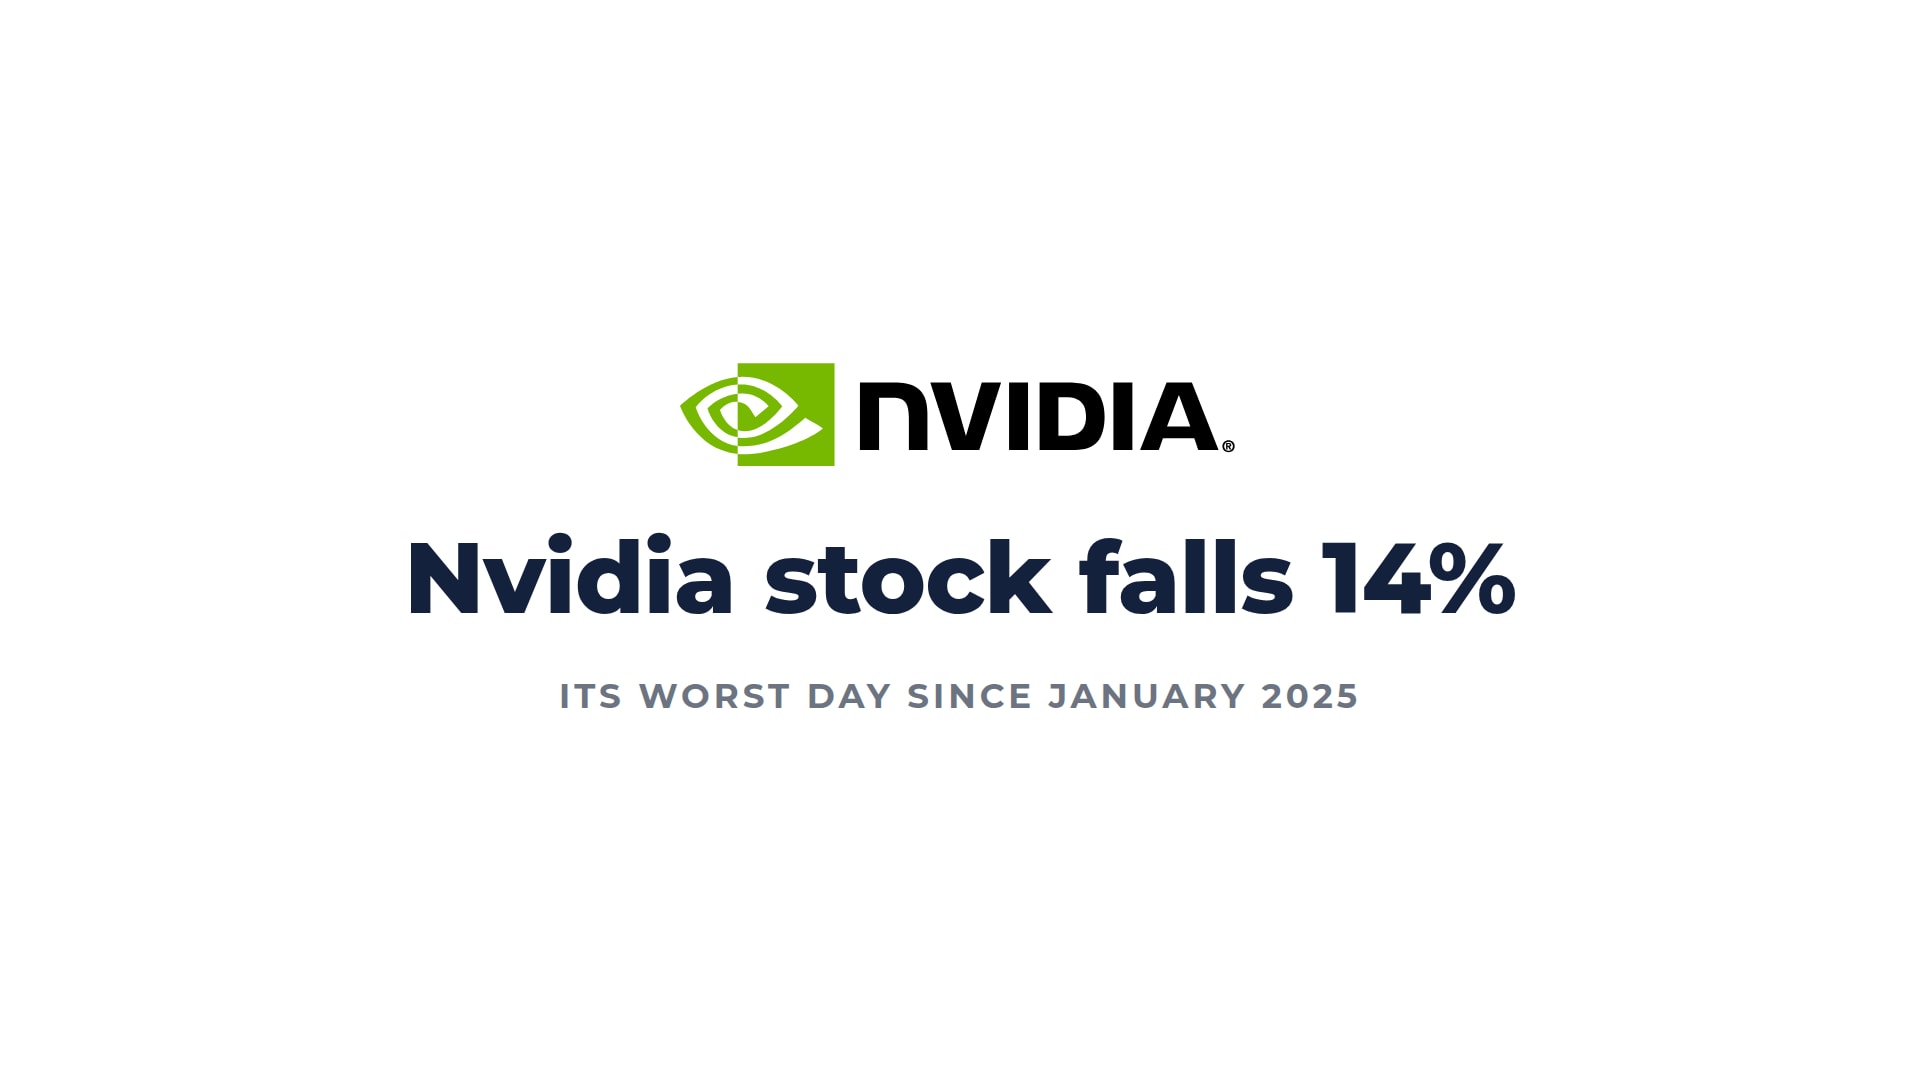
Jensen Huang resigned as Nvidia's CEO during the streak. On Nov. 20, the stock fell 14.0% after Reuters reported that the Securities and Exchange Commission is examining potential accounting issues at the company.
Nvidia's 2008 streak ended with a flat week, then another loss
Nvidia fell 53.2% over seven weeks in 2008, from $24.70 on May 30 to $11.56 on July 18. Most of the decline came in the fifth week. On July 2, 2008, Nvidia said in a filing that it would take a charge of $150 million to $200 million to cover notebook computer chips that were failing at higher than normal rates. The stock fell 30.7% the next day.
The streak didn't end with a gain. Nvidia closed at $11.56 again on July 25, 2008, unchanged from a week earlier, and fell 6.2% the week after. I count a losing week only when the stock closes below the prior week's close, so the flat week ended the streak at seven. Nvidia went nine weeks in 2008 without a weekly gain.
| Time after July 18, 2008 | Nvidia change |
|---|---|
| 1 month | +14.4% |
| 3 months | -33.4% |
| 6 months | -30.9% |
| 12 months | +5.7% |
Source: Yahoo Finance daily closing prices. Changes are measured from the July 18, 2008, close, using 21, 63, 126, and 252 trading days for one, three, six, and 12 months.
Nvidia's lowest close after the 2008 streak came on Nov. 20, 2008, during the financial crisis, at $5.90. That was 49.0% below the July 18 close. The stock didn't close above its pre-streak level of $24.70 until Jan. 24, 2011.
Nvidia was lower a month later after 8 of 12 five-week streaks
One earlier seven-week streak is too few to compare, so I also measured the 12 streaks that reached five weeks. Each change below starts from the close of the fifth straight losing week.
| Time after fifth weekly loss | Median change | Higher in |
|---|---|---|
| Next week | +1.1% | 8 of 12 |
| 1 month | -3.2% | 4 of 12 |
| 3 months | -8.2% | 5 of 12 |
| 6 months | -0.3% | 6 of 12 |
| 12 months | +20.7% | 8 of 12 |
Source: Yahoo Finance daily closing prices since Jan. 22, 1999. The current streak isn't included.
Eight of the 12 streaks ended at five weeks. The four that continued were in 2002, 2008, and twice in 2012. Nvidia was lower one month after the sixth weekly loss in all four.
The current streak has been steeper than any of the 12 after that point. Nvidia fell 32.7% in the two weeks after its fifth weekly loss on Nov. 6. The largest two-week decline after any earlier fifth week was 17.2%, in April 2002.
All 12 earlier Nvidia losing streaks of five weeks or more
| Fifth weekly loss | Streak length | Drop in first five weeks | 1 month later | 3 months later | 12 months later |
|---|---|---|---|---|---|
| April 12, 2002 | 5 weeks | -37.1% | -7.8% | -45.7% | -63.9% |
| June 21, 2002 | 6 weeks | -42.1% | -29.4% | -59.4% | +0.8% |
| June 9, 2006 | 5 weeks | -31.7% | -10.3% | +29.7% | +70.0% |
| July 3, 2008 | 7 weeks | -49.4% | -15.3% | -25.3% | -15.5% |
| May 21, 2010 | 5 weeks | -25.4% | -9.2% | -21.7% | +42.1% |
| March 16, 2012 | 6 weeks | -8.2% | -4.0% | -15.8% | -13.6% |
| May 4, 2012 | 5 weeks | -20.4% | -1.5% | +11.9% | +13.4% |
| Oct. 19, 2012 | 6 weeks | -12.5% | -2.4% | +0.7% | +28.0% |
| Oct. 10, 2014 | 5 weeks | -15.6% | +18.8% | +16.9% | +56.4% |
| Jan. 28, 2022 | 5 weeks | -22.9% | +2.8% | -18.8% | -14.5% |
| April 29, 2022 | 5 weeks | -33.0% | +0.7% | -0.6% | +52.1% |
| Oct. 14, 2022 | 5 weeks | -22.0% | +45.1% | +57.7% | +291.4% |
Source: Yahoo Finance daily closing prices. The 1-month, 3-month, and 12-month changes are measured from the close on the date of the fifth weekly loss.
In the current streak, Nvidia was down 20.2% after its first five weeks.
How I read these numbers
I don't read these tables as a signal to buy or sell. One earlier seven-week streak isn't a pattern, and 12 five-week streaks are a small sample. Six of the 12 came in 2002, 2008, and 2022, years when the Nasdaq Composite fell more than 30%.
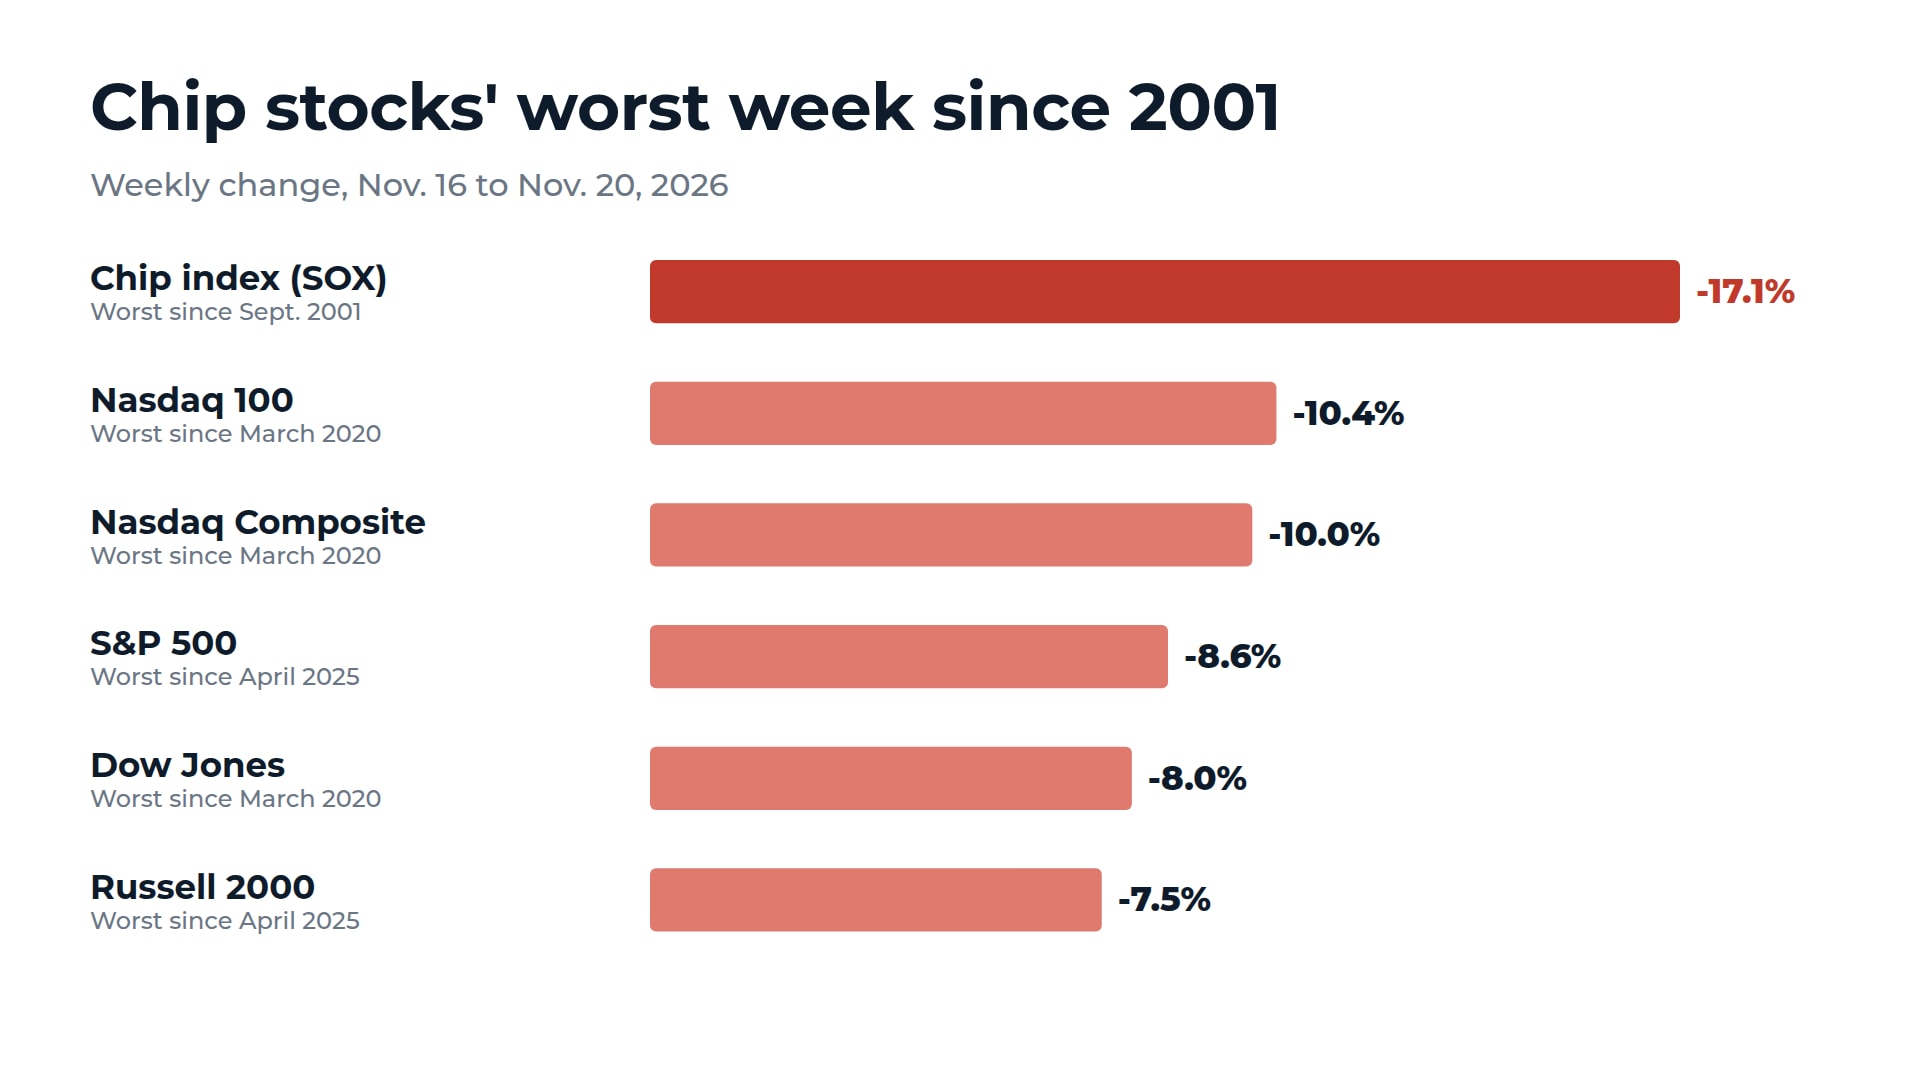
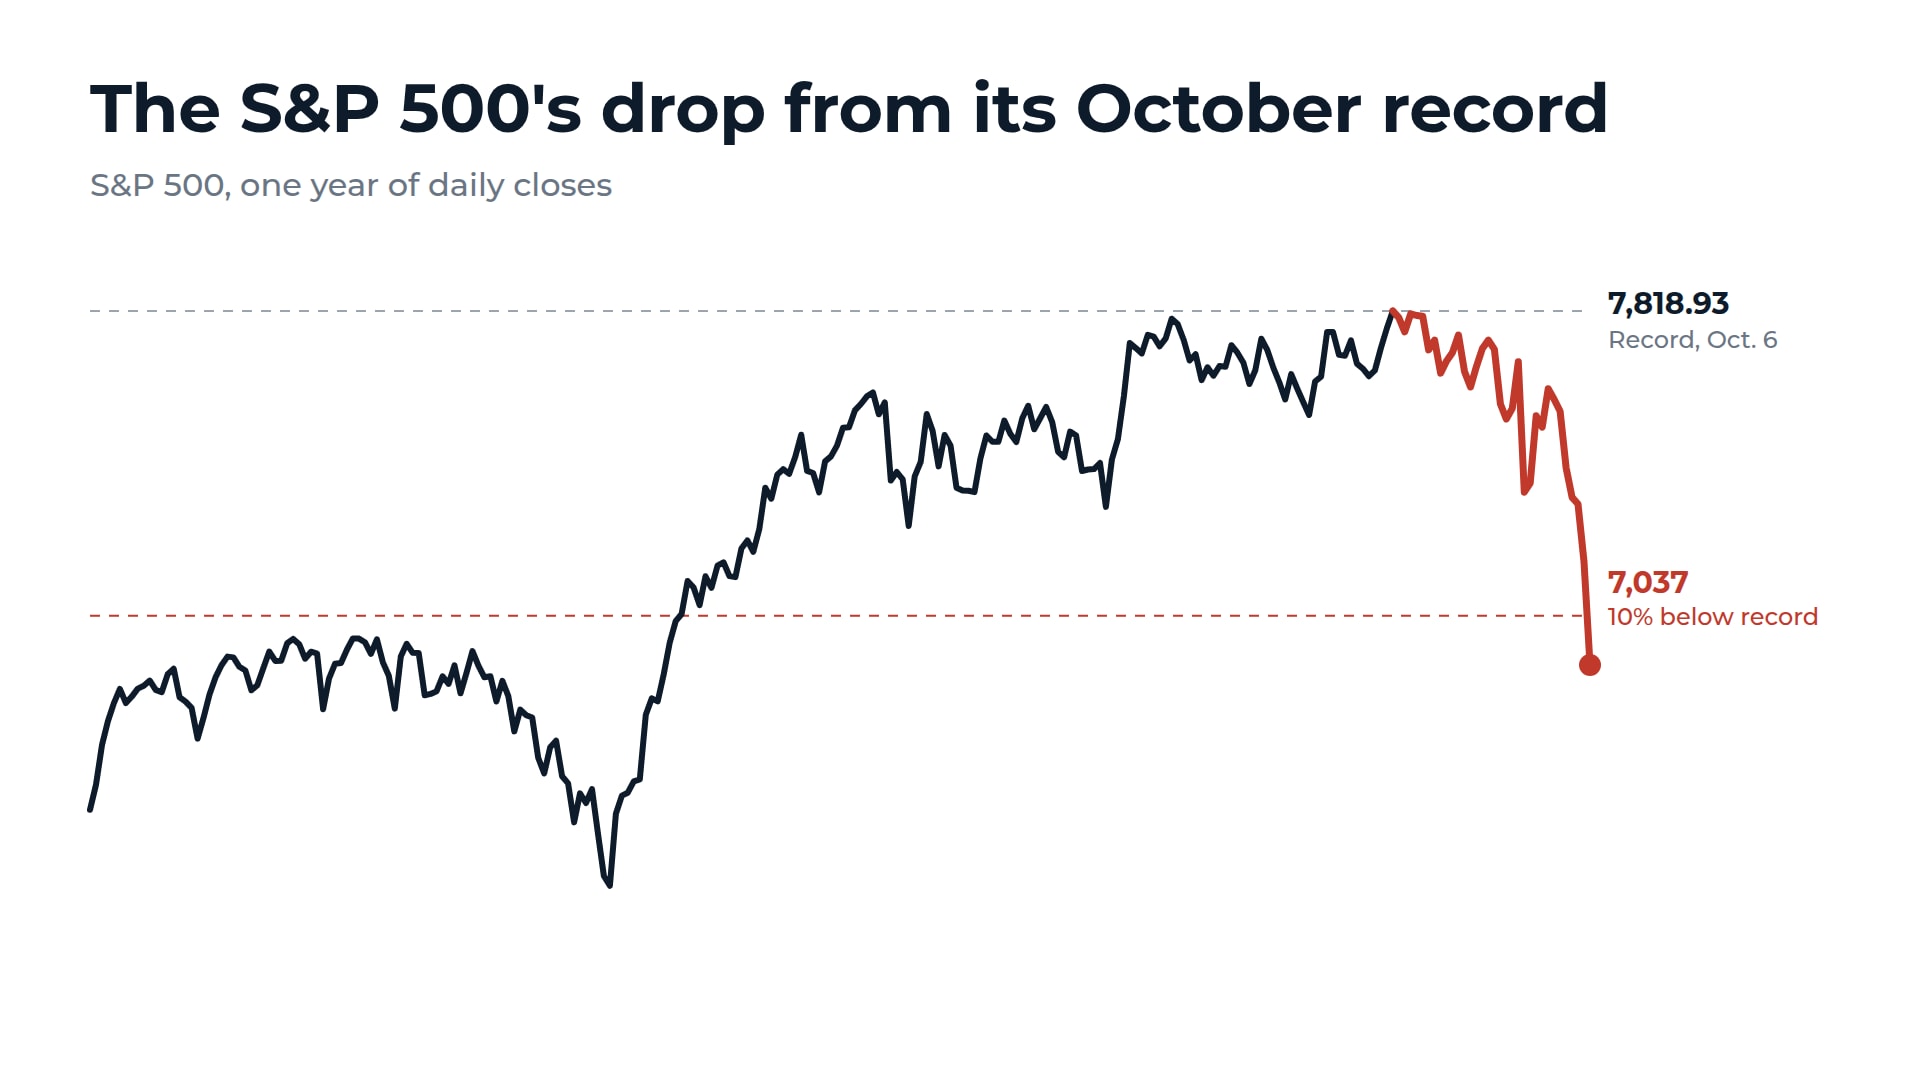
The S&P 500 entered a correction on Nov. 20. I ran a similar count on its 26 earlier corrections.
How we counted: A week's close is the last closing price of each calendar week. A losing week is a weekly close below the prior week's close. An unchanged week ends a streak. For the 12-streak analysis, changes are measured from the close of the fifth straight losing week, using 21, 63, 126, and 252 trading days for one, three, six, and 12 months. "Next week" is the change to the following weekly close.
Prices come from Yahoo Finance daily closes beginning Jan. 22, 1999, adjusted for stock splits but not dividends. We checked the 2026 closes against Nasdaq and reproduced all 12 streaks with daily closes from Financial Modeling Prep. Its split-adjusted prices are rounded, which moves eight of the 48 changes in the table above by 0.1 percentage point. The 2008 prices are shown as they traded at the time, before Nvidia's 4-for-1 split in 2021 and 10-for-1 split in 2024.