Key points
- How the S&P 500's Thanksgiving week compares with a normal week
- Most of the S&P 500's holiday-week gain came before Thursday
- The S&P 500's Thanksgiving weeks that began in a correction
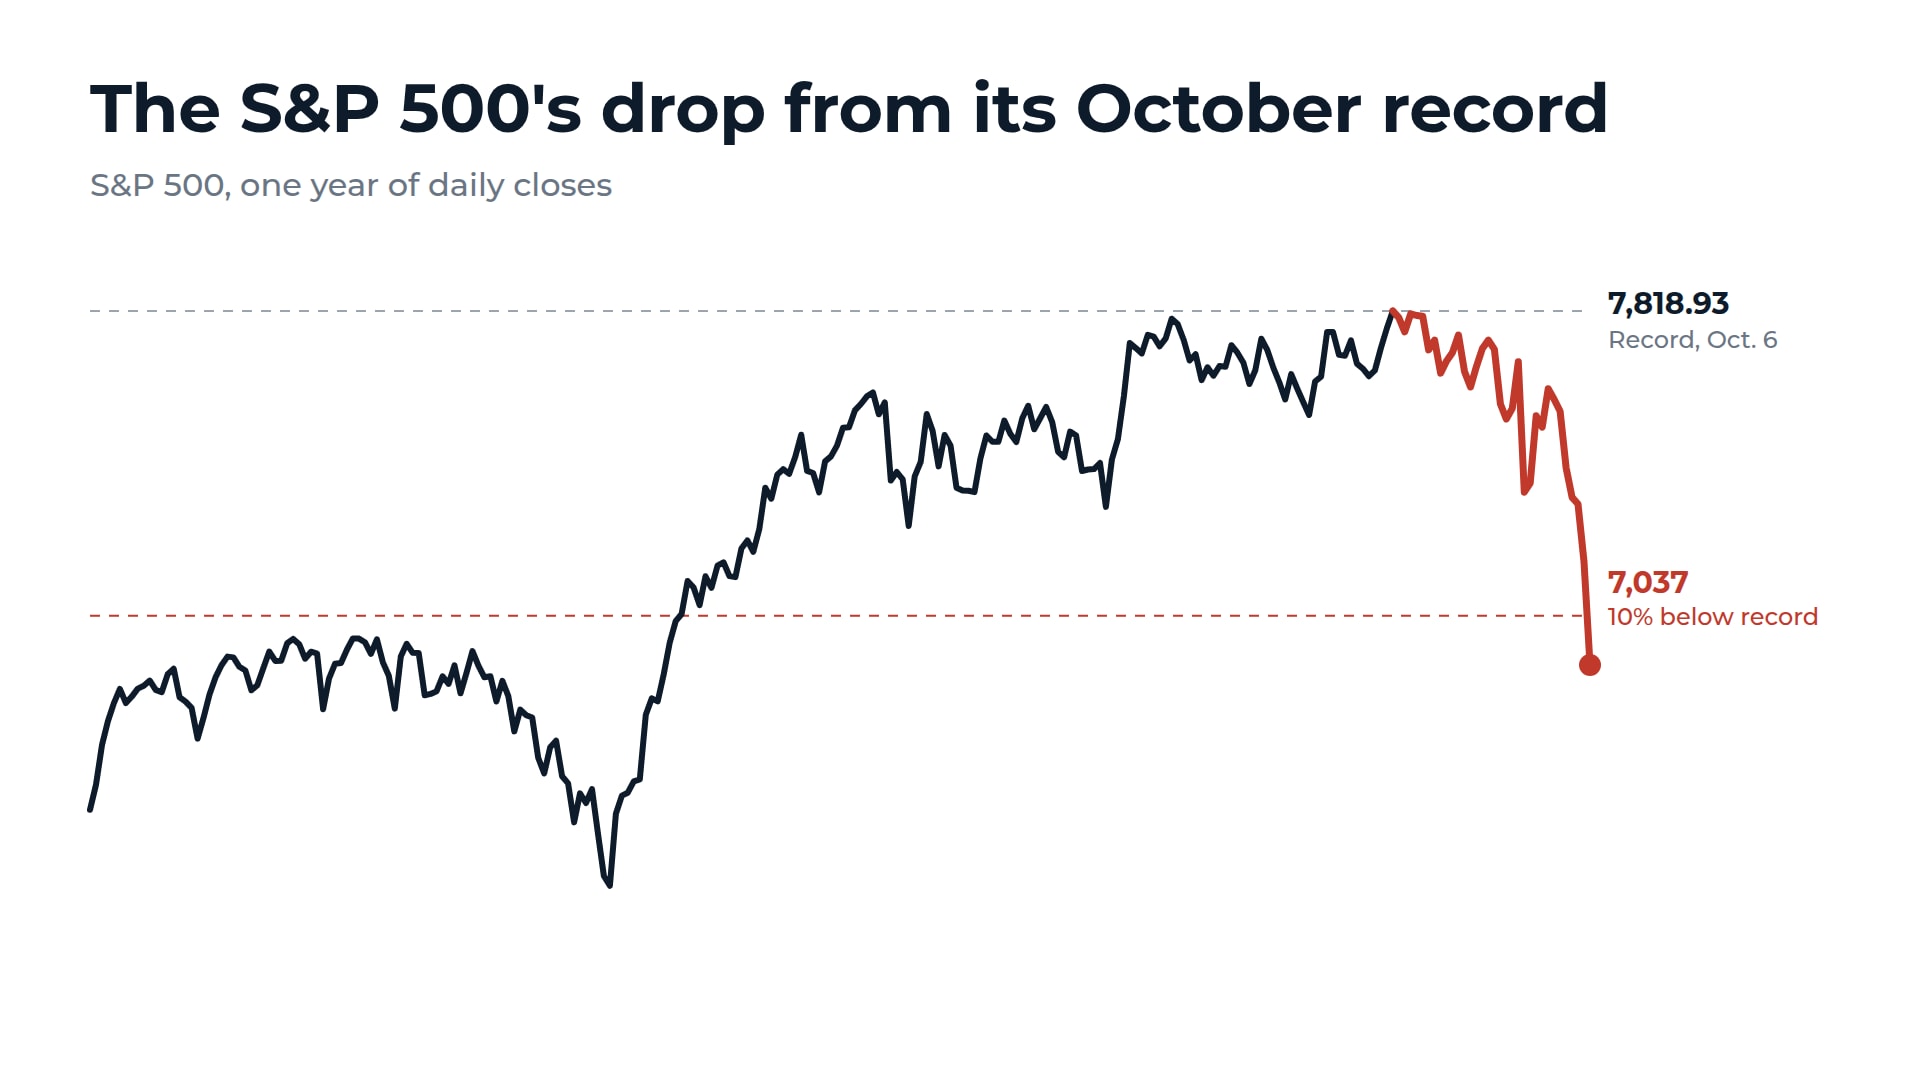
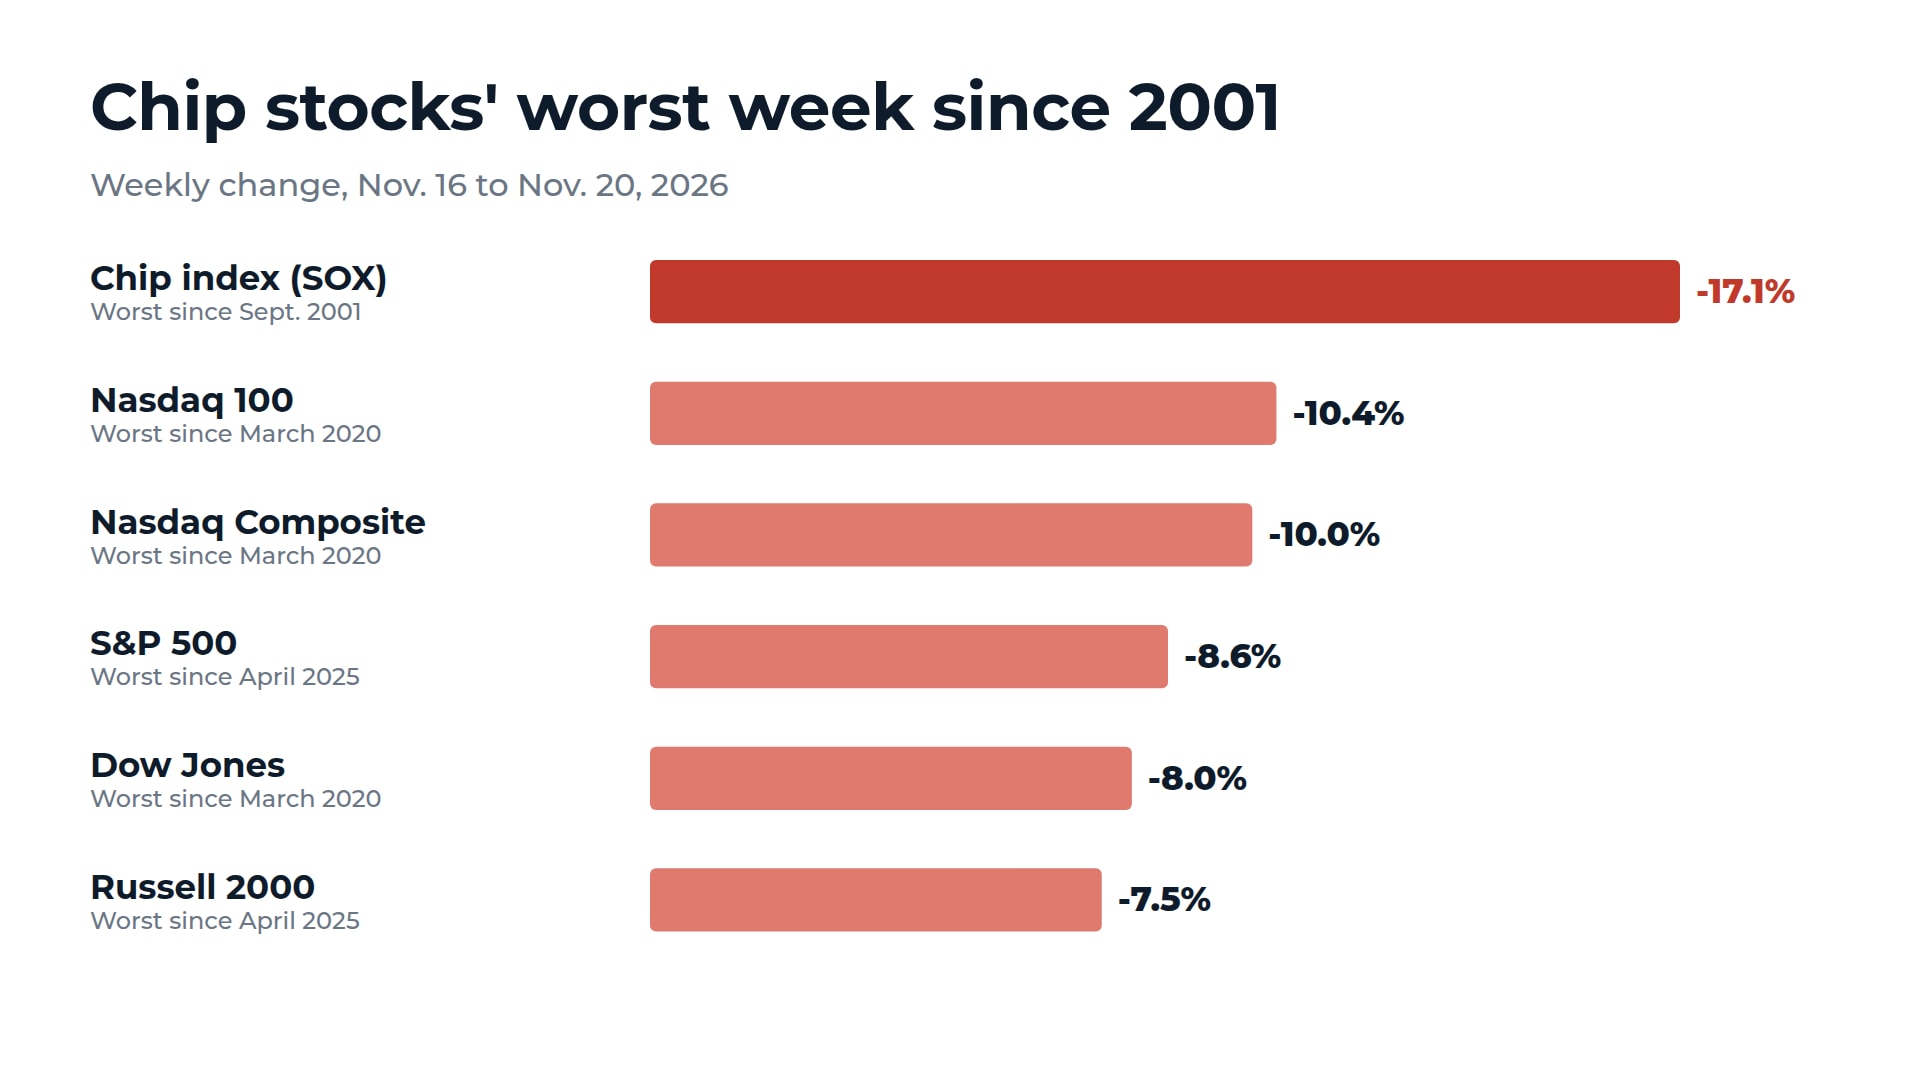
The S&P 500 has finished Thanksgiving week higher in 19 of the last 25 years. This year, the index enters the holiday week in a correction after falling 8.6%, its worst week since April 2025.
I went through S&P 500 closes for every Thanksgiving week from 2001 through 2025. The average gain was 0.90%, and the median was 0.99%. Across all weeks in those 25 years, the index rose 57% of the time and gained an average of 0.16%.
One year lifts the average. The S&P 500 rose 12.03% in Thanksgiving week of 2008, the largest gain of the 25. Without 2008, the average gain is 0.44%.
The New York Stock Exchange will be closed on Thursday, Nov. 26, and will close early at 1 p.m. ET on Friday, Nov. 27. I measured each week from the close on the Friday before Thanksgiving to the close on the Friday after.
The S&P 500 started 30 Thanksgiving weeks at least 10% below its record
The S&P 500 closed at 6,910.39 on Nov. 20, which is 11.6% below its Oct. 6 record close. The index started Thanksgiving week at least 10% below its record close in 30 of the 73 years from 1953 through 2025. It rose in 22 of those weeks, with a median gain of 1.04%.
Those results are close to the full record. Across all 73 years, the S&P 500 rose in 51 Thanksgiving weeks, with a median gain of 0.85%.
The size of last week's drop has little precedent. In closes back to 1953, the index had not lost that much in the week before Thanksgiving week. The closest case is 2008, when the index fell 8.39% and then rose 12.03%.
The index lost at least 3% in the week before Thanksgiving week in three other years. The S&P 500 rose 5.20% in the holiday week of 1963 and 1.55% in 1974, and it fell 4.69% in 2011. Four cases are too few to call a pattern.
Most of the gain came before Thanksgiving
The S&P 500 gained an average of 0.89% from Monday through Wednesday of Thanksgiving week and rose in 19 of the 25 years. Wednesday alone was positive in 18 years, with an average gain of 0.33%.
The Friday after Thanksgiving was nearly flat on average. The index rose on 13 of those Fridays and fell on 12, for an average gain of 0.01%. Its worst was a 2.27% drop on Nov. 26, 2021.
That's a change from earlier decades: The S&P 500 rose on the Friday after Thanksgiving in 39 of the 48 years from 1953 through 2000.
The Nasdaq Composite, which entered a correction on Nov. 5, rose in 20 of the last 25 Thanksgiving weeks, with an average gain of 1.12%. The Dow Jones Industrial Average rose in 17, with an average gain of 0.70%.
I don't read these numbers as a signal to buy. The average Thanksgiving-week gain was higher than the average weekly gain over the past 25 years, but the S&P 500 still fell in six of those holiday weeks.
Thanksgiving week for the S&P 500, 2001 to 2025
| Year | Thanksgiving | Full week | Monday to Wednesday | Friday |
|---|---|---|---|---|
| 2001 | Nov. 22 | +1.03% | -0.14% | +1.17% |
| 2002 | Nov. 28 | +0.62% | +0.89% | -0.27% |
| 2003 | Nov. 27 | +2.21% | +2.24% | -0.02% |
| 2004 | Nov. 25 | +1.05% | +0.98% | +0.08% |
| 2005 | Nov. 24 | +1.60% | +1.39% | +0.21% |
| 2006 | Nov. 23 | -0.02% | +0.35% | -0.37% |
| 2007 | Nov. 22 | -1.24% | -2.88% | +1.69% |
| 2008 | Nov. 27 | +12.03% | +10.96% | +0.96% |
| 2009 | Nov. 26 | +0.01% | +1.76% | -1.72% |
| 2010 | Nov. 25 | -0.86% | -0.12% | -0.75% |
| 2011 | Nov. 24 | -4.69% | -4.43% | -0.27% |
| 2012 | Nov. 22 | +3.62% | +2.29% | +1.30% |
| 2013 | Nov. 28 | +0.06% | +0.14% | -0.08% |
| 2014 | Nov. 27 | +0.20% | +0.45% | -0.25% |
| 2015 | Nov. 26 | +0.05% | -0.01% | +0.06% |
| 2016 | Nov. 24 | +1.44% | +1.05% | +0.39% |
| 2017 | Nov. 23 | +0.91% | +0.71% | +0.21% |
| 2018 | Nov. 22 | -3.79% | -3.16% | -0.66% |
| 2019 | Nov. 28 | +0.99% | +1.39% | -0.40% |
| 2020 | Nov. 26 | +2.27% | +2.03% | +0.24% |
| 2021 | Nov. 25 | -2.20% | +0.07% | -2.27% |
| 2022 | Nov. 24 | +1.53% | +1.56% | -0.03% |
| 2023 | Nov. 23 | +1.00% | +0.94% | +0.06% |
| 2024 | Nov. 28 | +1.06% | +0.49% | +0.56% |
| 2025 | Nov. 27 | +3.73% | +3.17% | +0.54% |
Source: Yahoo Finance daily S&P 500 closes. The full week runs from the close on the Friday before Thanksgiving to the close on the Friday after.
How we counted: Thanksgiving week runs from the close on the Friday before the holiday to the close on the Friday after. The Monday-to-Wednesday figure runs from the prior Friday's close to Wednesday's close. The all-weeks comparison covers 1,304 weeks from 2001 through 2025, each measured from the last close of one week to the last close of the next. Daily closes come from Yahoo Finance. We checked 29 of the S&P 500 closes since November 2016 against Federal Reserve Bank of St. Louis data, and the holiday hours against the New York Stock Exchange calendar. Before March 1957, the S&P index tracked 90 stocks instead of 500.