Key points
- The VIX rose for a fourth straight day, up more than 45%
- How often the VIX rises four days in a row
- The 10 bigger VIX streaks since 1990
- What the S&P 500 did after past VIX streaks
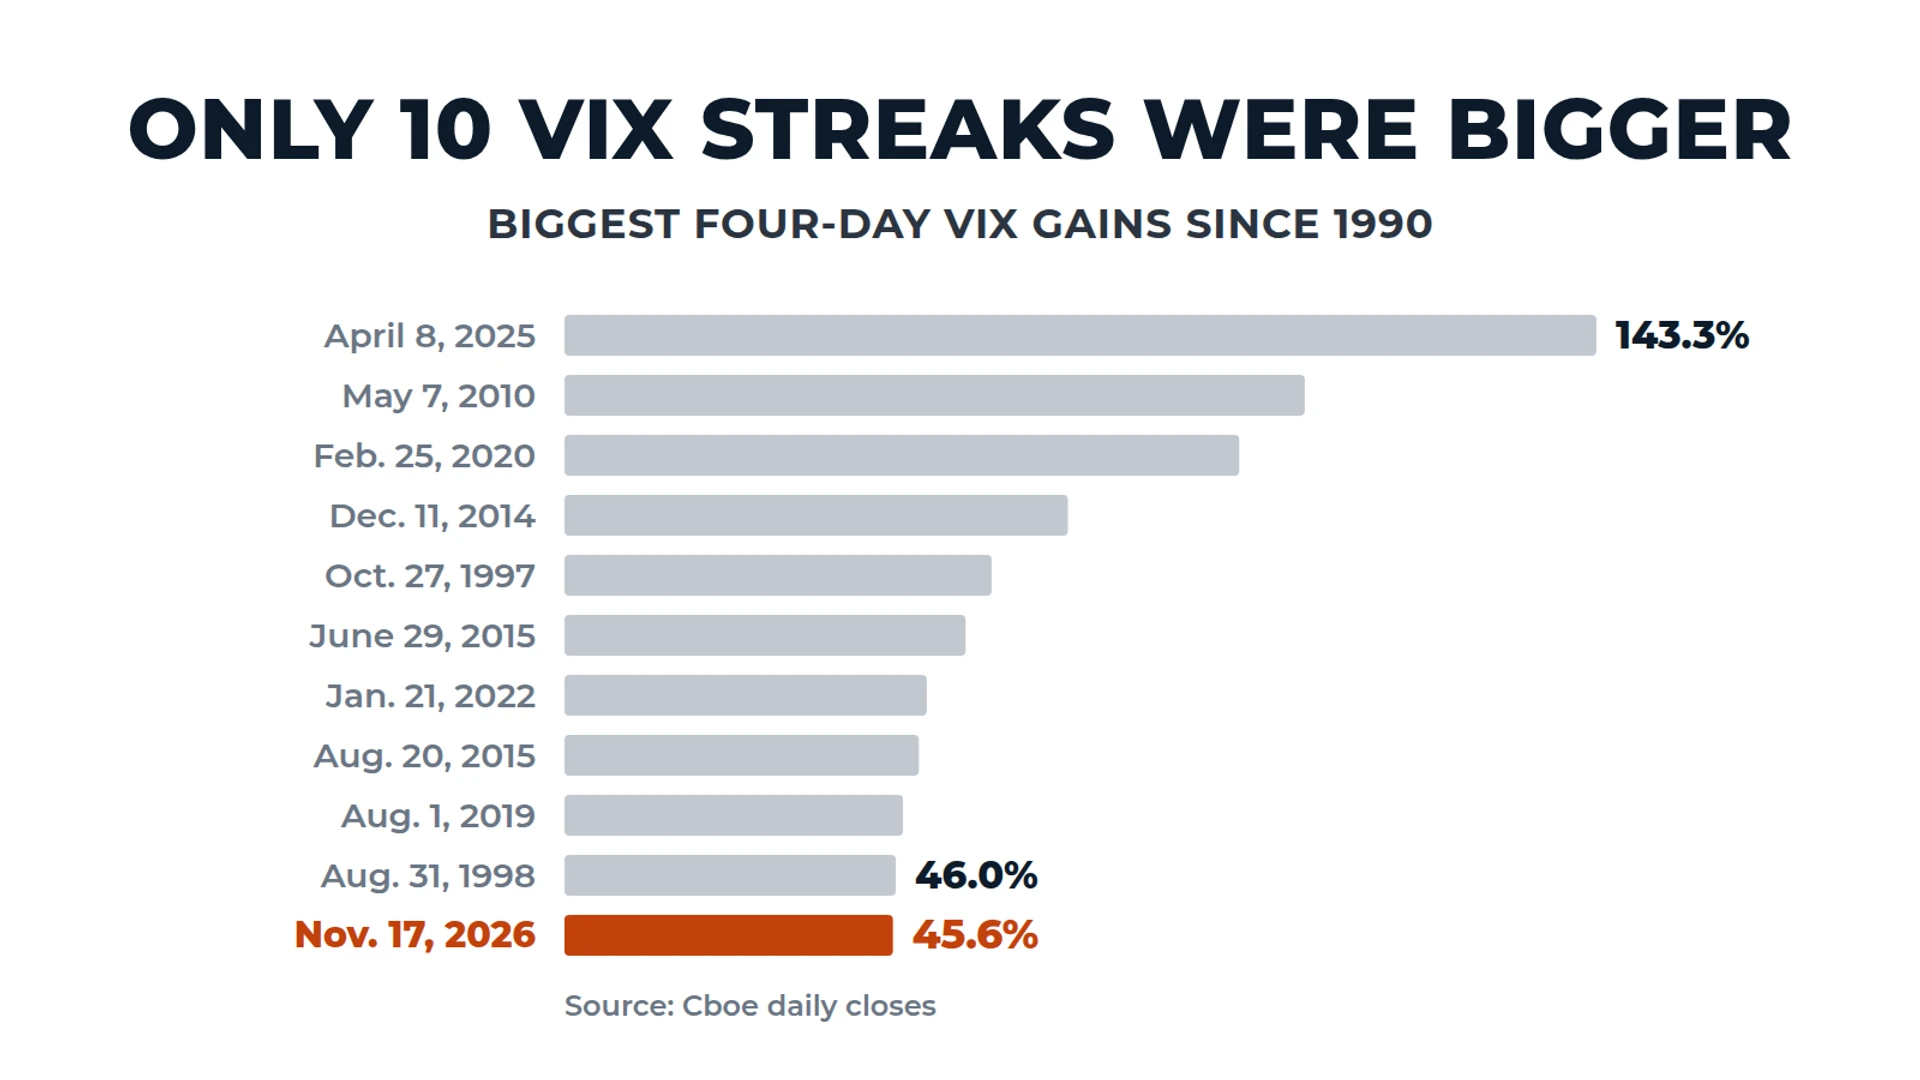
The Cboe Volatility Index, or VIX, closed at 25.46 on Nov. 17, its fourth straight higher close. Wall Street's fear gauge has climbed 46% since Nov. 11, when it closed at 17.49. That is the biggest four-session rise in the VIX since April 2025, by our count of Cboe's daily closes.
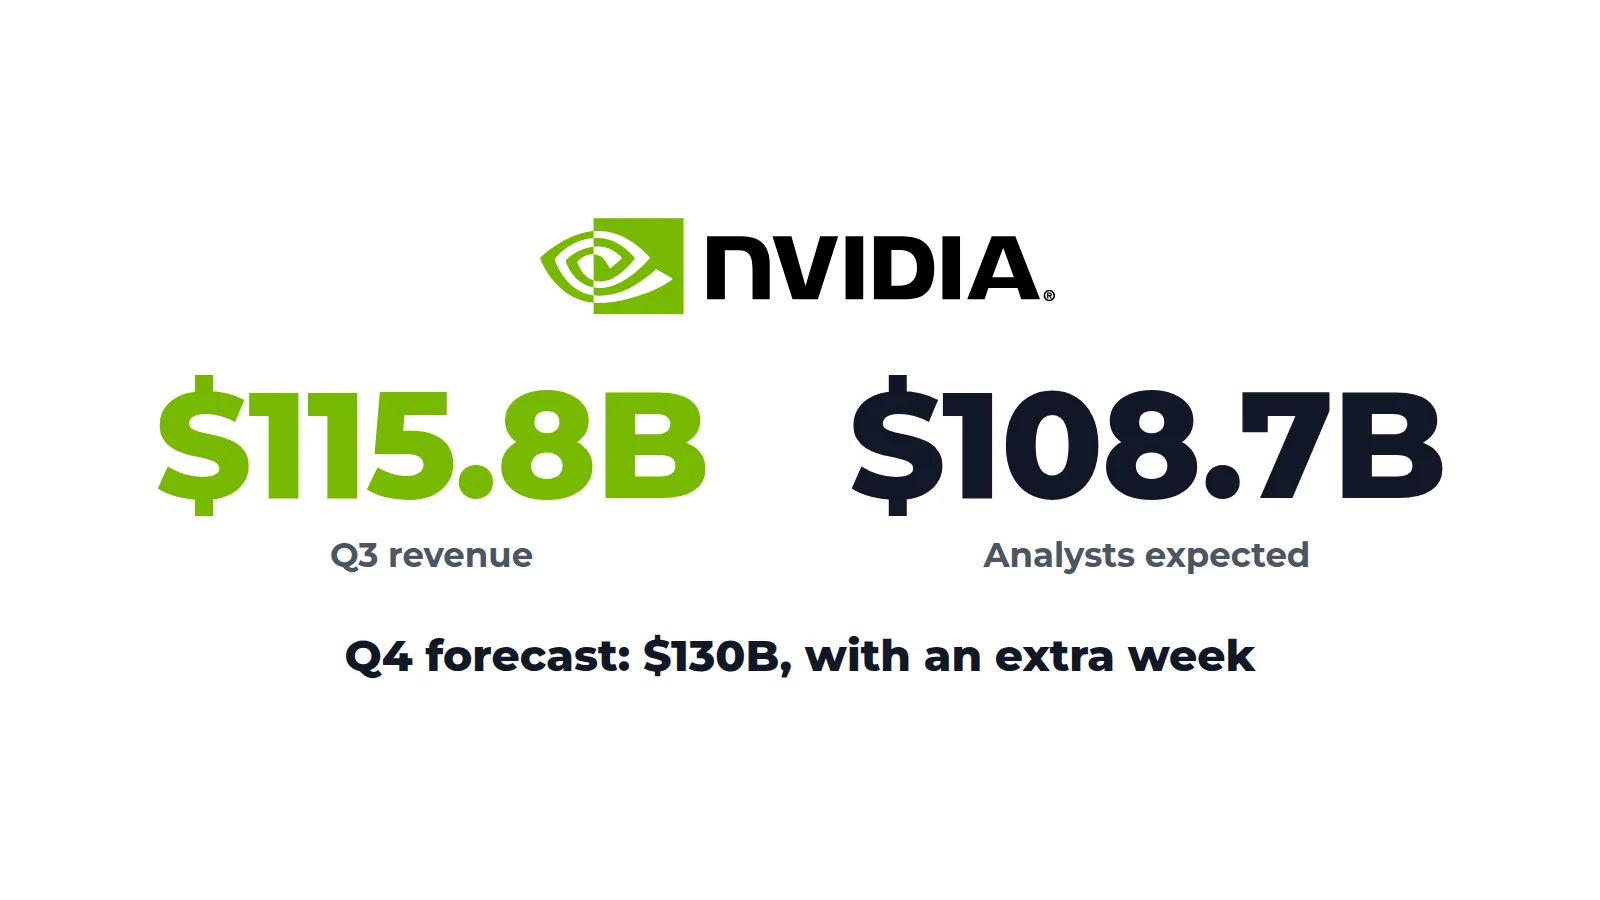
The S&P 500 closed at 7,340.53 on Nov. 17, down 1.0% on the day. The VIX measures how much movement options traders expect in the S&P 500 over the next 30 days, as our VIX explainer lays out. Its rise came ahead of Nvidia's (NVDA) third-quarter results after the close on Nov. 17.
The VIX is still below where it closed on Nov. 5, when it jumped to 28.18 in a single day, and on Nov. 6, when it closed at 25.64.
The VIX rises four days in a row about five times a year
We counted every streak in Cboe's VIX history, which starts on Jan. 2, 1990. We counted a day only if the VIX closed higher than the day before, and we counted each streak once, on its fourth day, even if it ran for five days or more. By that measure, the VIX has risen at least four days in a row 198 times before this streak, about five times a year. It happened five times in 2025 and twice earlier in 2026.
Of the 198 earlier streaks, 87 continued for a fifth day, or 44%.
Only 10 four-day streaks were bigger
Of the 198 earlier streaks, only 10 had a bigger gain over their first four days than this one's 45.6%.
| Fourth day of streak | VIX before streak | VIX on fourth day | Four-day gain |
|---|---|---|---|
| Oct. 27, 1997 | 19.53 | 31.12 | 59.3% |
| Aug. 31, 1998 | 30.33 | 44.28 | 46.0% |
| May 7, 2010 | 20.19 | 40.95 | 102.8% |
| Dec. 11, 2014 | 11.82 | 20.08 | 69.9% |
| June 29, 2015 | 12.11 | 18.85 | 55.7% |
| Aug. 20, 2015 | 12.83 | 19.14 | 49.2% |
| Aug. 1, 2019 | 12.16 | 17.87 | 47.0% |
| Feb. 25, 2020 | 14.38 | 27.85 | 93.7% |
| Jan. 21, 2022 | 19.19 | 28.85 | 50.3% |
| April 8, 2025 | 21.51 | 52.33 | 143.3% |
| Nov. 17, 2026 | 17.49 | 25.46 | 45.6% |
The list includes the week of the May 6, 2010, flash crash, the start of the COVID-19 selloff in February 2020, and the April 2025 tariff selloff.
The S&P 500 usually rose after VIX streaks
A four-day VIX streak hasn't been a reliable sign of more stock losses. After the 198 earlier streaks, the S&P 500 was higher one month later 68% of the time, with a median gain of 1.7%. That is a little better than the index's record on all days since 1990, when it was higher a month later 64% of the time, with a median gain of 1.2%.
The 10 bigger streaks were split. One month after the fourth day, the S&P 500 was higher in four of the 10, with a median change of minus 0.8%. Three months later, it was higher in seven of the 10. Ten cases are too few to draw a pattern from.
We measured S&P 500 returns from the close on the fourth day of each streak, using 21 trading days for one month and 63 for three months.