Key points
- Micron and AMD each lost more than 17%
- Chip index was higher a month after five of six earlier drops
- One drop in 2000 took almost 16 years to recover
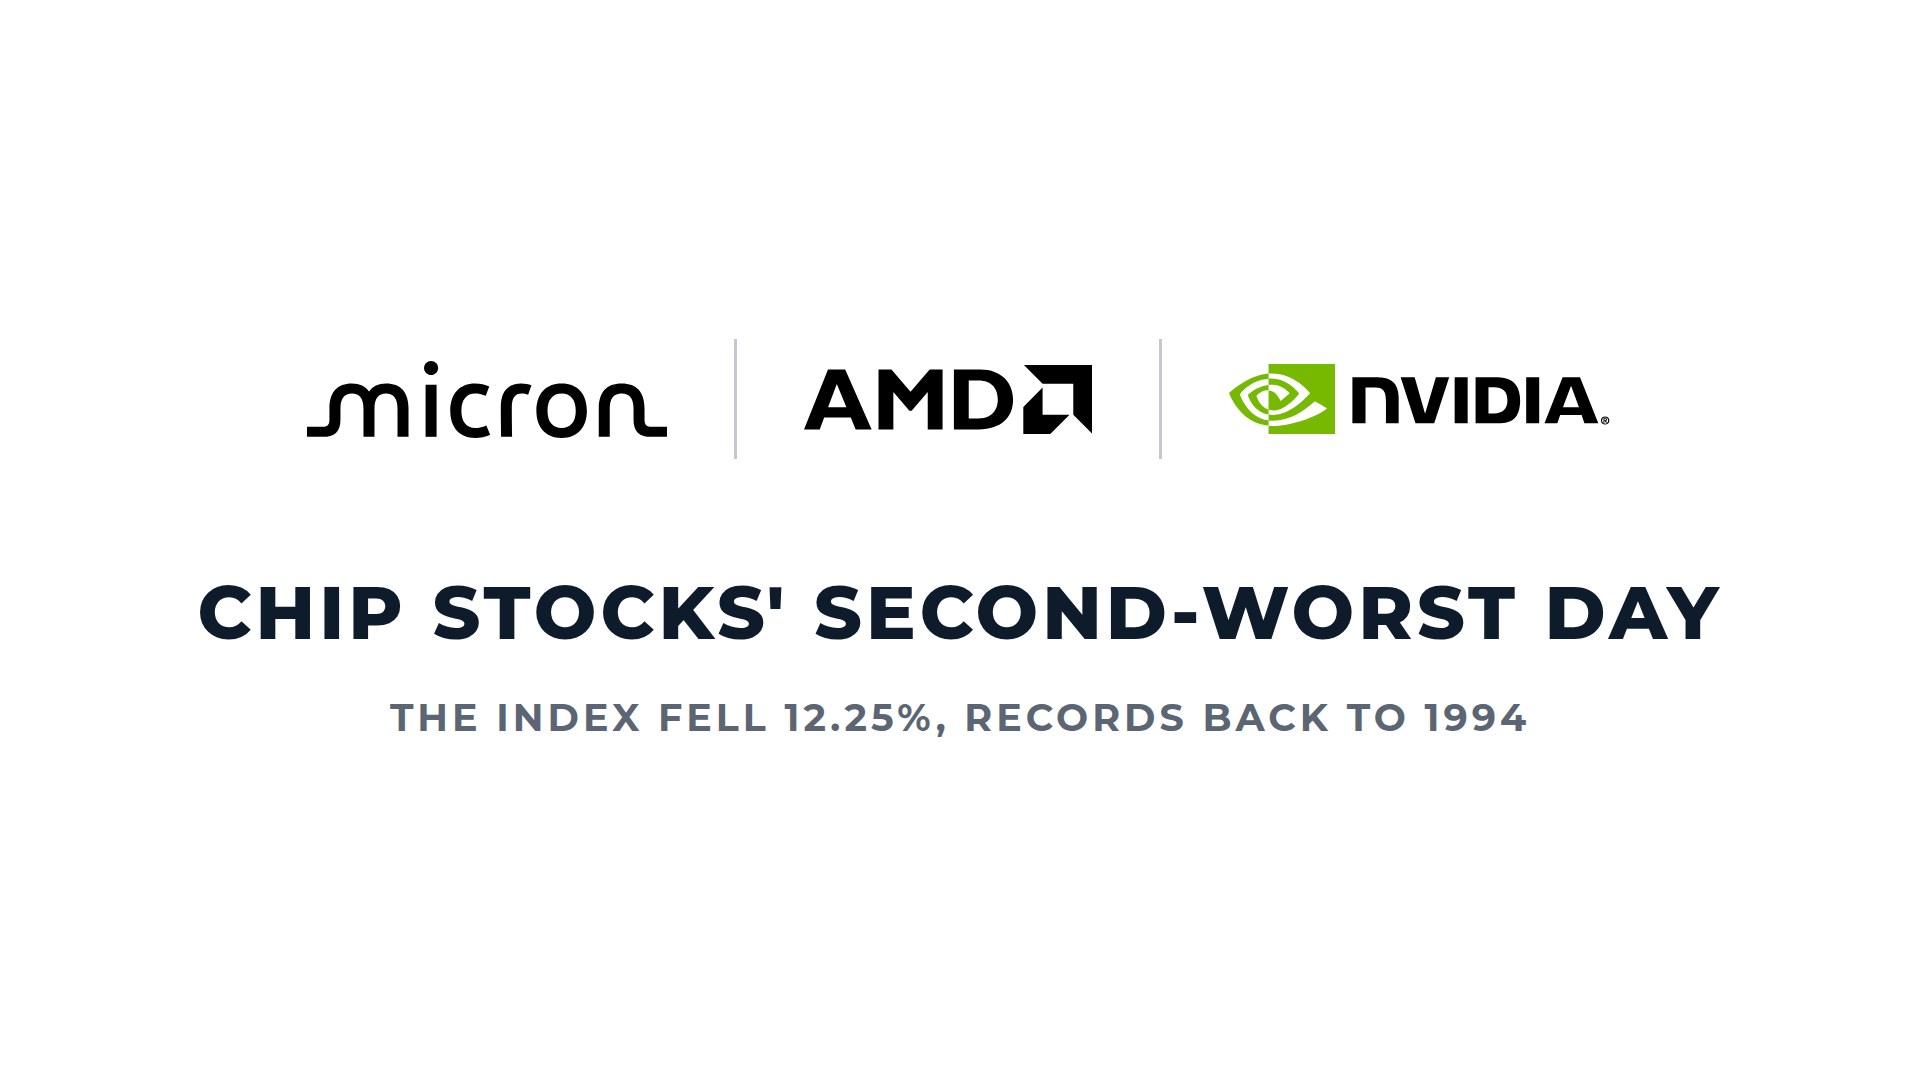
The Philadelphia Semiconductor Index fell 12.25% to 9,011.14 on November 5, its biggest one-day percentage drop since March 16, 2020. In Nasdaq's daily record back to 1994, only that 15.9% drop in 2020 was larger.
Micron (MU) fell 17.46%, and AMD (AMD) fell 17.26%. Lam Research (LRCX) lost 16.36%, Applied Materials (AMAT) lost 13.58%, and Broadcom (AVGO) lost 10.43%. Nvidia (NVDA) fell 9.26%, less than the index.
Reuters tied the selloff to fears of tighter AI regulation after Democrats won control of Congress. The index closed 38.4% below its June 22 record close of 14,634.72. It's still up 27.2% in 2026.
Six earlier drops of 10% or more
We went through the index's daily closes back to May 1994 and found six earlier one-day drops of at least 10%. Two came in 2000, one in 2002, two in March 2020, and one this June.
| Date | Drop | Next day | 1 month | 6 months | 12 months | Back to pre-drop close |
|---|---|---|---|---|---|---|
| Apr. 14, 2000 | -11.6% | +13.2% | +17.3% | -15.0% | -35.7% | 1 day |
| Oct. 10, 2000 | -10.1% | 0.0% | -5.9% | -20.1% | -34.5% | August 2016 |
| July 25, 2002 | -10.1% | -1.0% | +5.7% | -10.8% | +22.8% | 17 days |
| Mar. 12, 2020 | -10.9% | +10.9% | +16.6% | +53.6% | +113.0% | 10 days |
| Mar. 16, 2020 | -15.9% | +9.8% | +26.9% | +68.0% | +136.4% | 8 days |
| June 5, 2026 | -10.3% | +5.6% | +2.9% | n/a | n/a | 6 days |
Returns run from the close on the day of the drop. Days are trading days. Source: Yahoo Finance and Nasdaq closes, by our calculations.
The index was higher one month later in five of the six cases. The median gain was 11.2%.
The longer results split by era. All three cases from 2000 to 2002 were lower six months later. Both March 2020 cases were up more than 50%. The June 2026 case hasn't reached six months.
Similar one-day drops were followed by very different results.
The index had already fallen about the same distance in 2000 and 2020. It was 33.1% below its record on April 14, 2000, and 34.4% below its record on March 16, 2020. The July 2002 drop came with the index 76.1% below its record, so a large earlier fall didn't prevent further losses. It was still lower six months later.
The run-up did differ. The index rose 234% over the three years through the April 14, 2000, close and 30% over the three years through the March 16, 2020, close. It rose 180% over the three years through the November 5 close, which was 38.4% below its record.
The October 2000 drop took the longest to recover. The index had closed at 785.96 the day before the fall and didn't close back at or above that level until August 15, 2016.
The June drop came five months ago
The index fell 10.3% on June 5, then rose 5.6% the next day. It was back above its pre-drop close in six trading days and set its record on June 22.
The November 5 close was 26.3% below the June 5 close.
Six cases is a small sample, and the two March 2020 drops came just four days apart during the same selloff. Two others occurred in 2000.
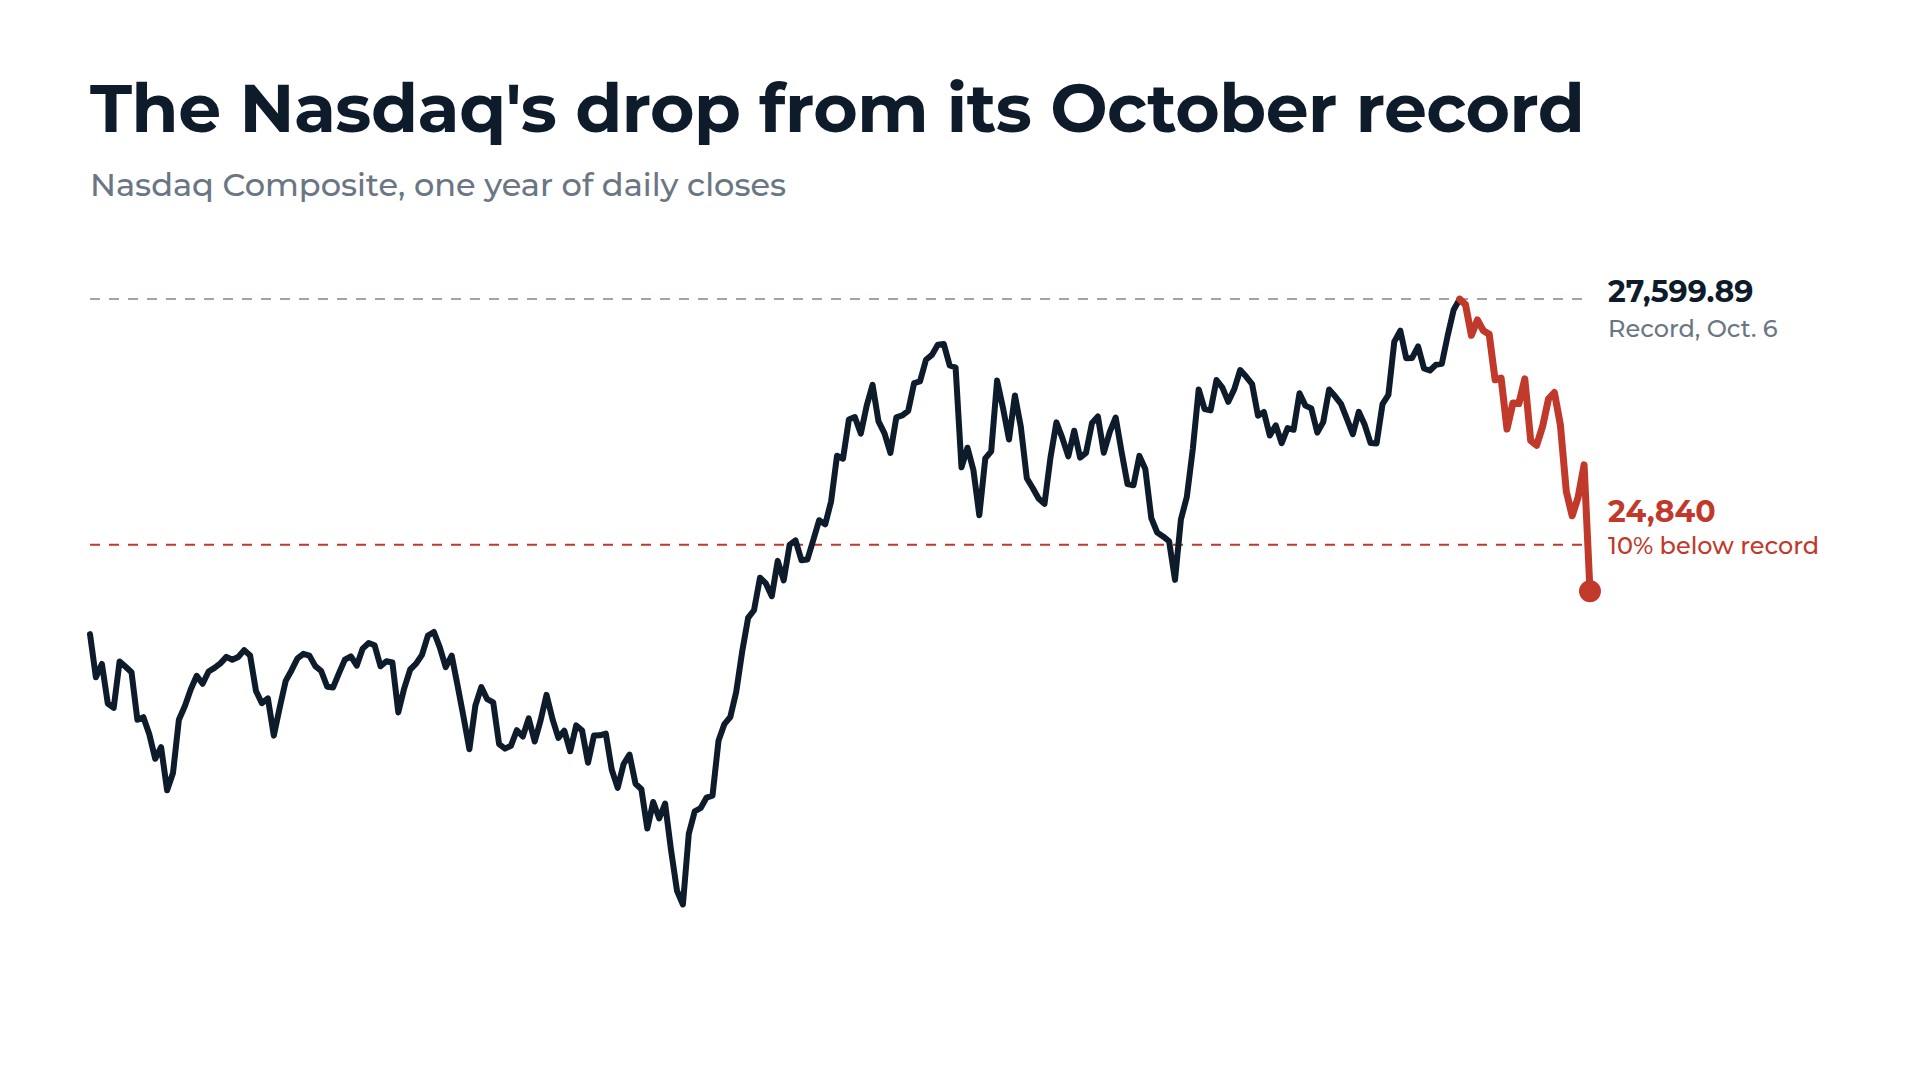
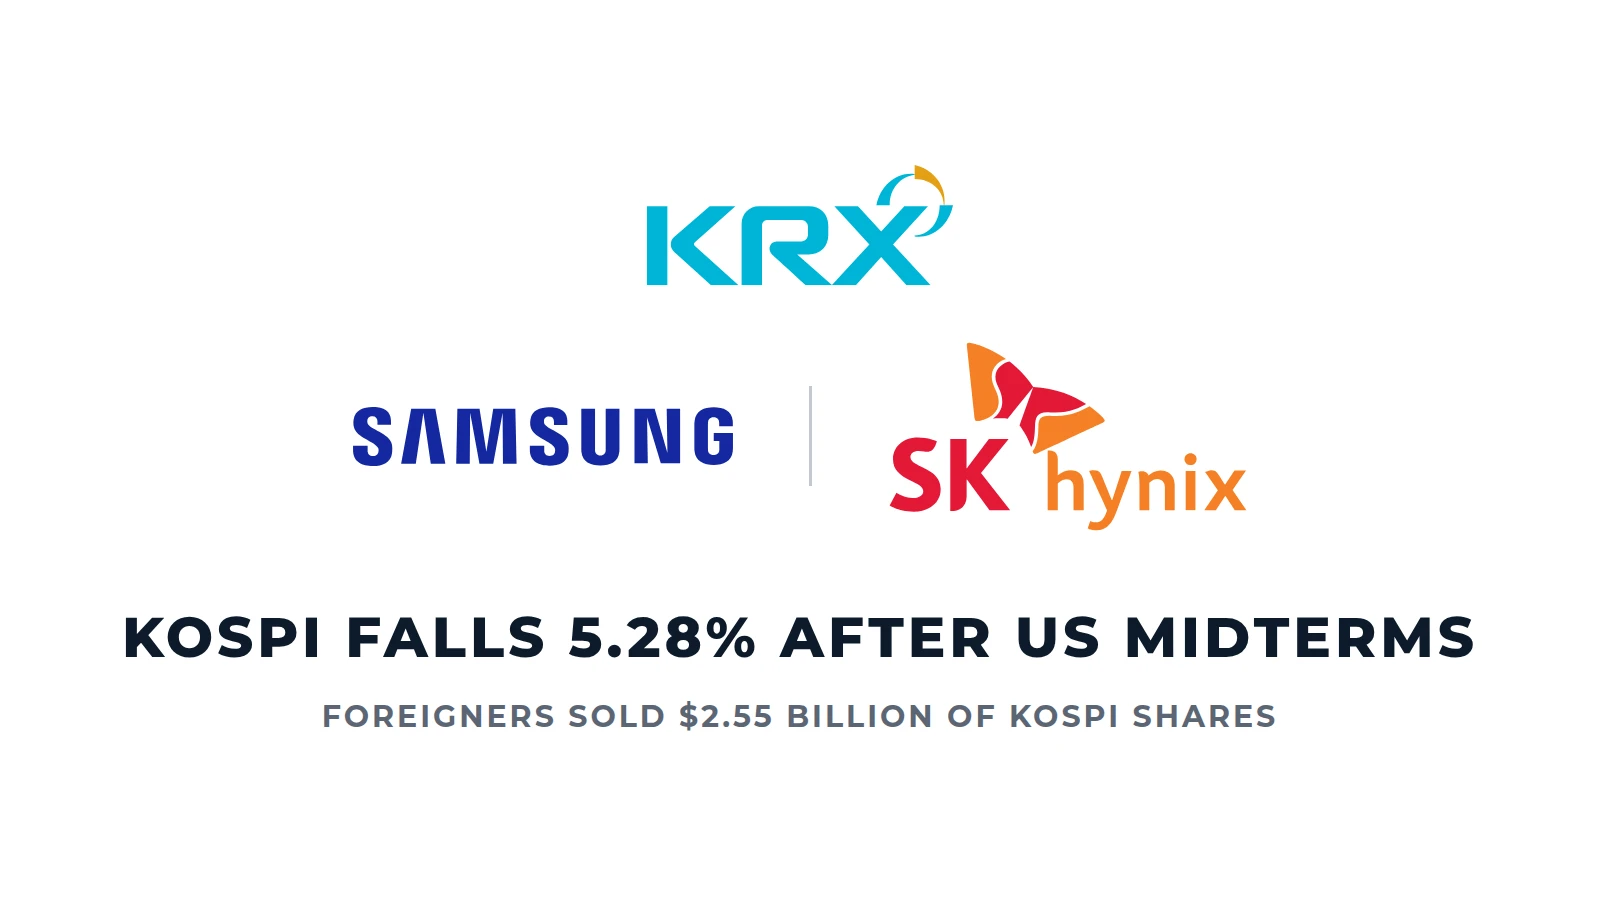
The selling reached Asia on November 6, when Korea's Kospi fell more than 8% and trading stopped for 20 minutes. We looked at what followed 31 Nasdaq corrections on November 5.
How we counted: We used daily closes from Yahoo Finance back to May 4, 1994, and checked each date in the table against Nasdaq's series. A case is a close at least 10% below the previous close. One month, six months, 12 months, and three years are 21, 126, 252, and 756 trading days. The largest drop in 2008 was 8.9%, so that year isn't in the table. Nasdaq's older closes are rounded, so a few figures differ by up to 0.1 point.