Key points
- Why I'm rethinking my Anthropic IPO call
- How the S&P 500 did after 17 VIX spikes
- What the dot-com crash shows about a calm VIX
In July, I wrote that the OpenAI and Anthropic IPOs would mark the top of this AI cycle. "That is usually when a mania finds its ceiling," I wrote.
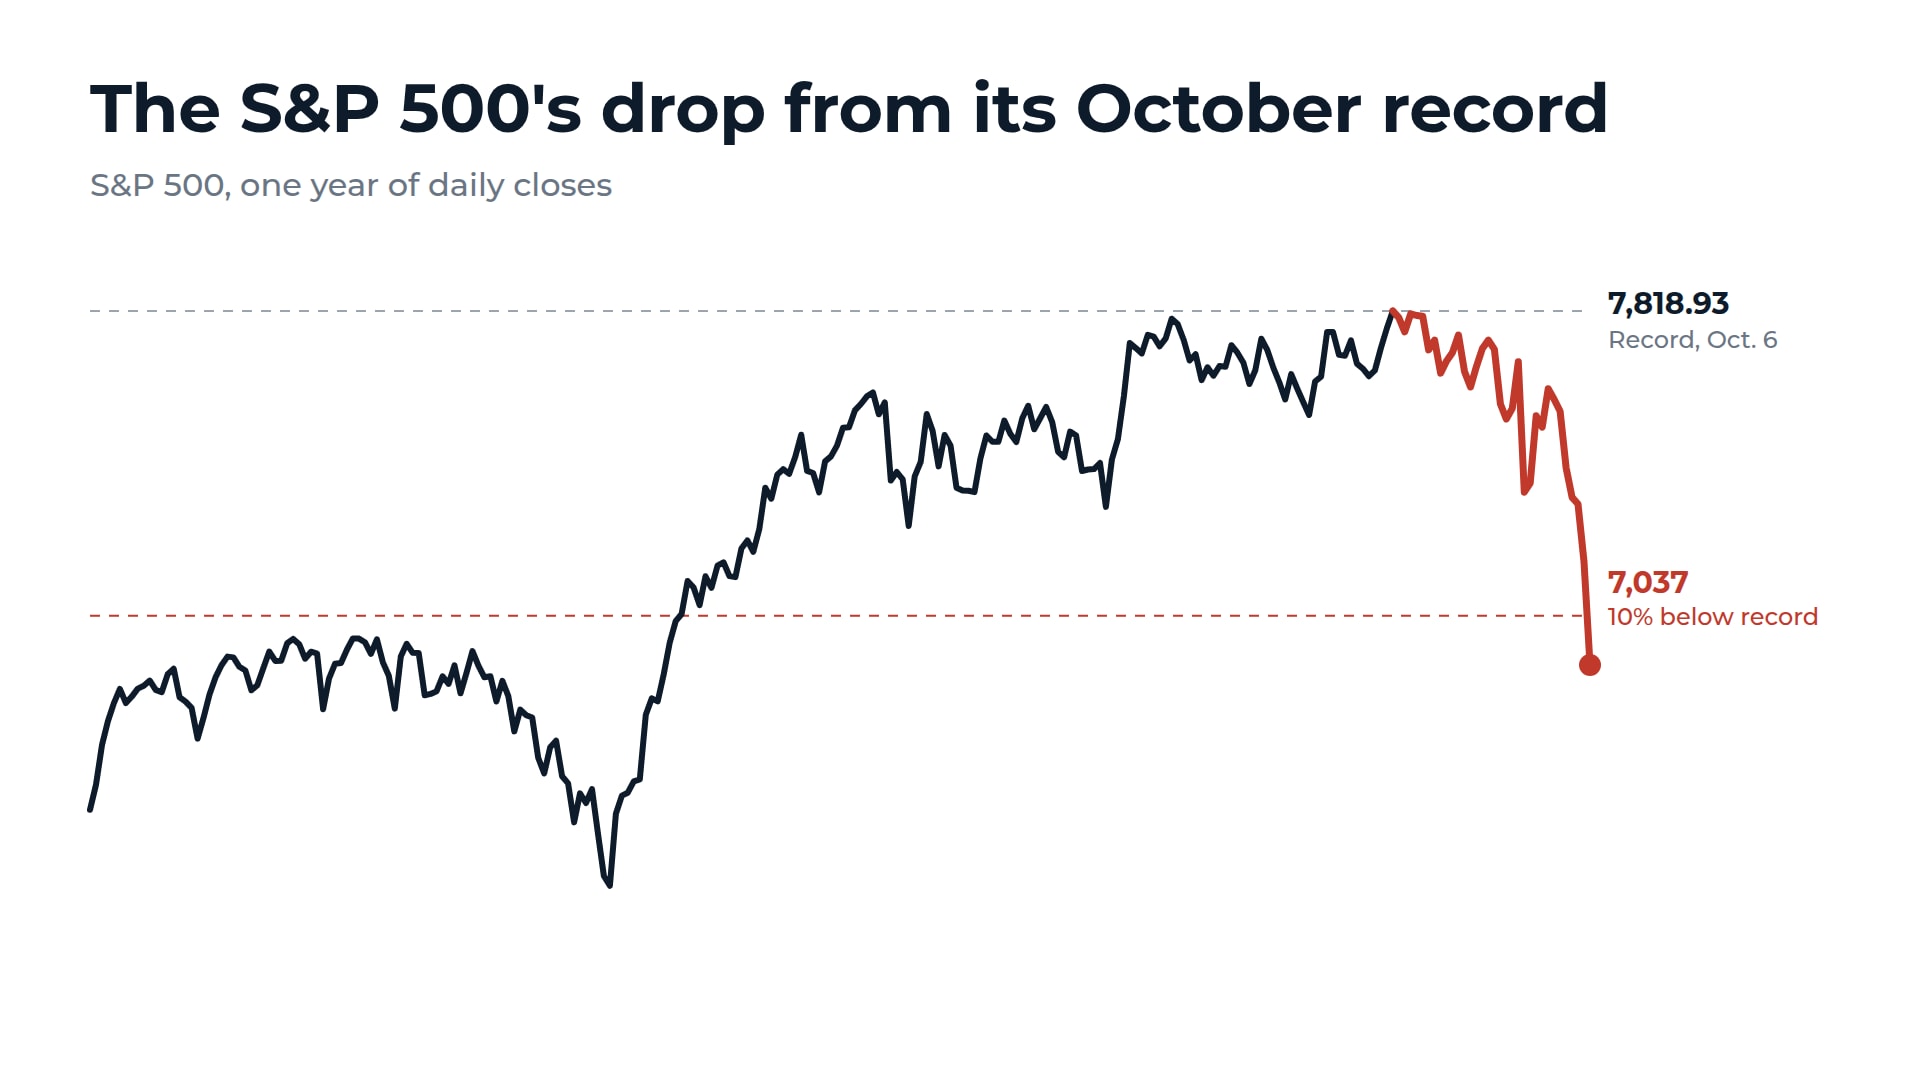
Anthropic (ANT) went public on Nov. 19. By the next afternoon, its shares touched a low 5 cents above their $83 IPO price as the broader market fell. The timing of my call wasn't right, though: The S&P 500 had set its record close on Oct. 6, six weeks before Anthropic's first trade.
Four months ago, I'd have read this selloff as the bubble popping on schedule. Now I'm asking a different question: Has this much fear marked an opportunity in the past, or warned of more losses ahead?
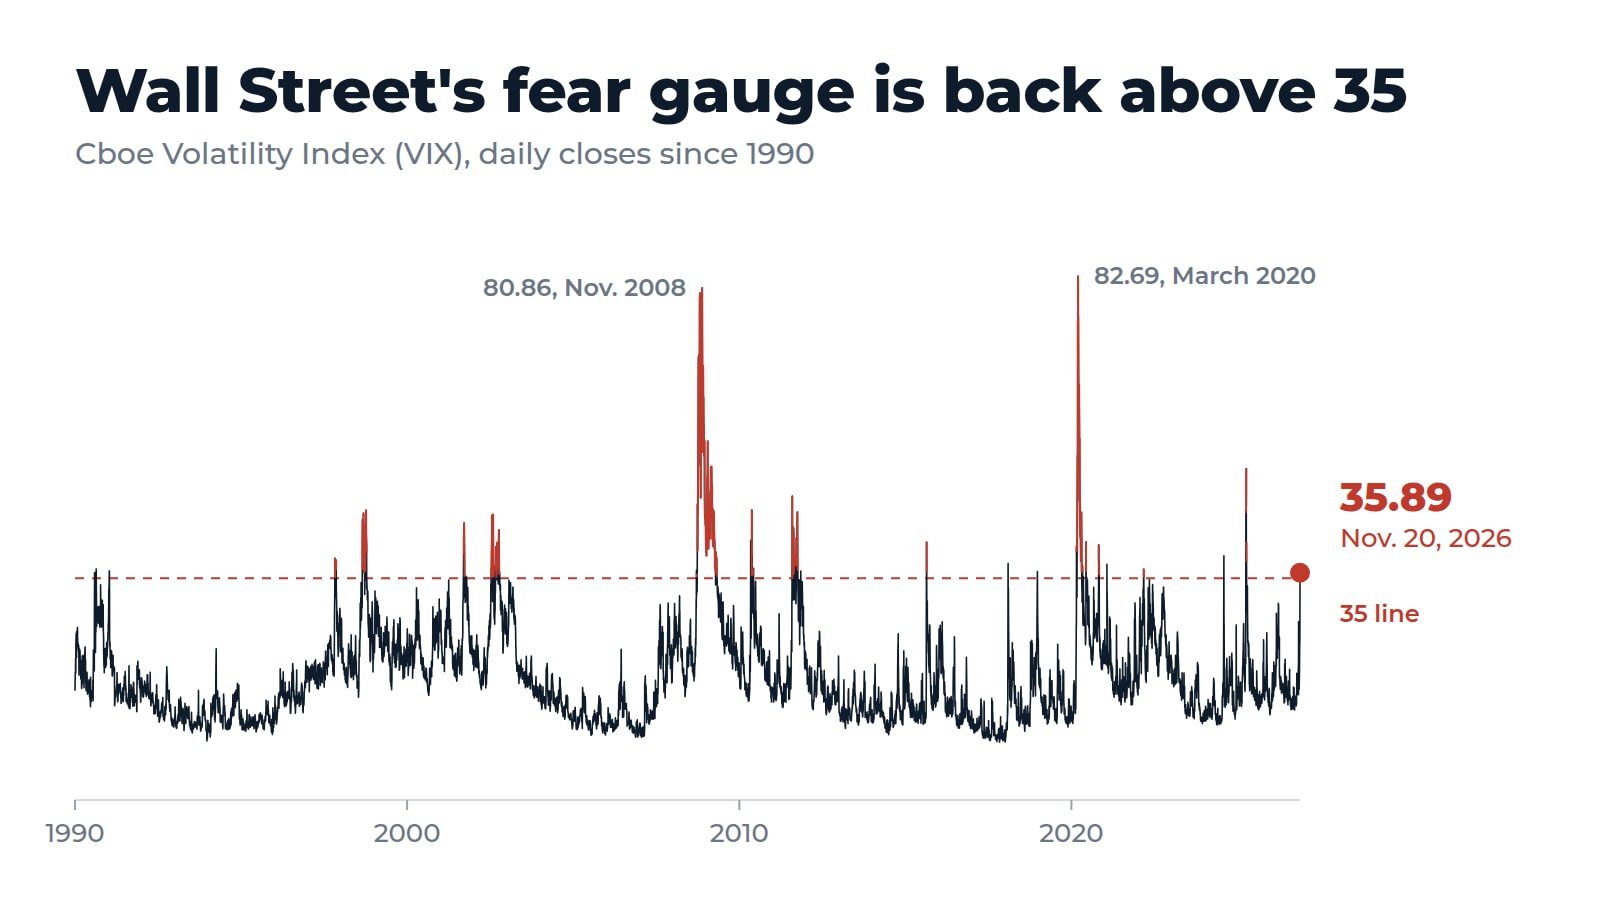
I looked at 17 earlier episodes when the Cboe Volatility Index, or VIX, closed at or above 35 after at least 60 trading days below that level. The S&P 500 was higher 12 months later in 14 of them. In seven, though, it fell at least another 10% first.
The VIX measures expected movement in the S&P 500 over the next 30 days, based on options prices, as our VIX explainer lays out. It reflects expectations for the broad index. The AI trade can move differently, as the dot-com crash showed.
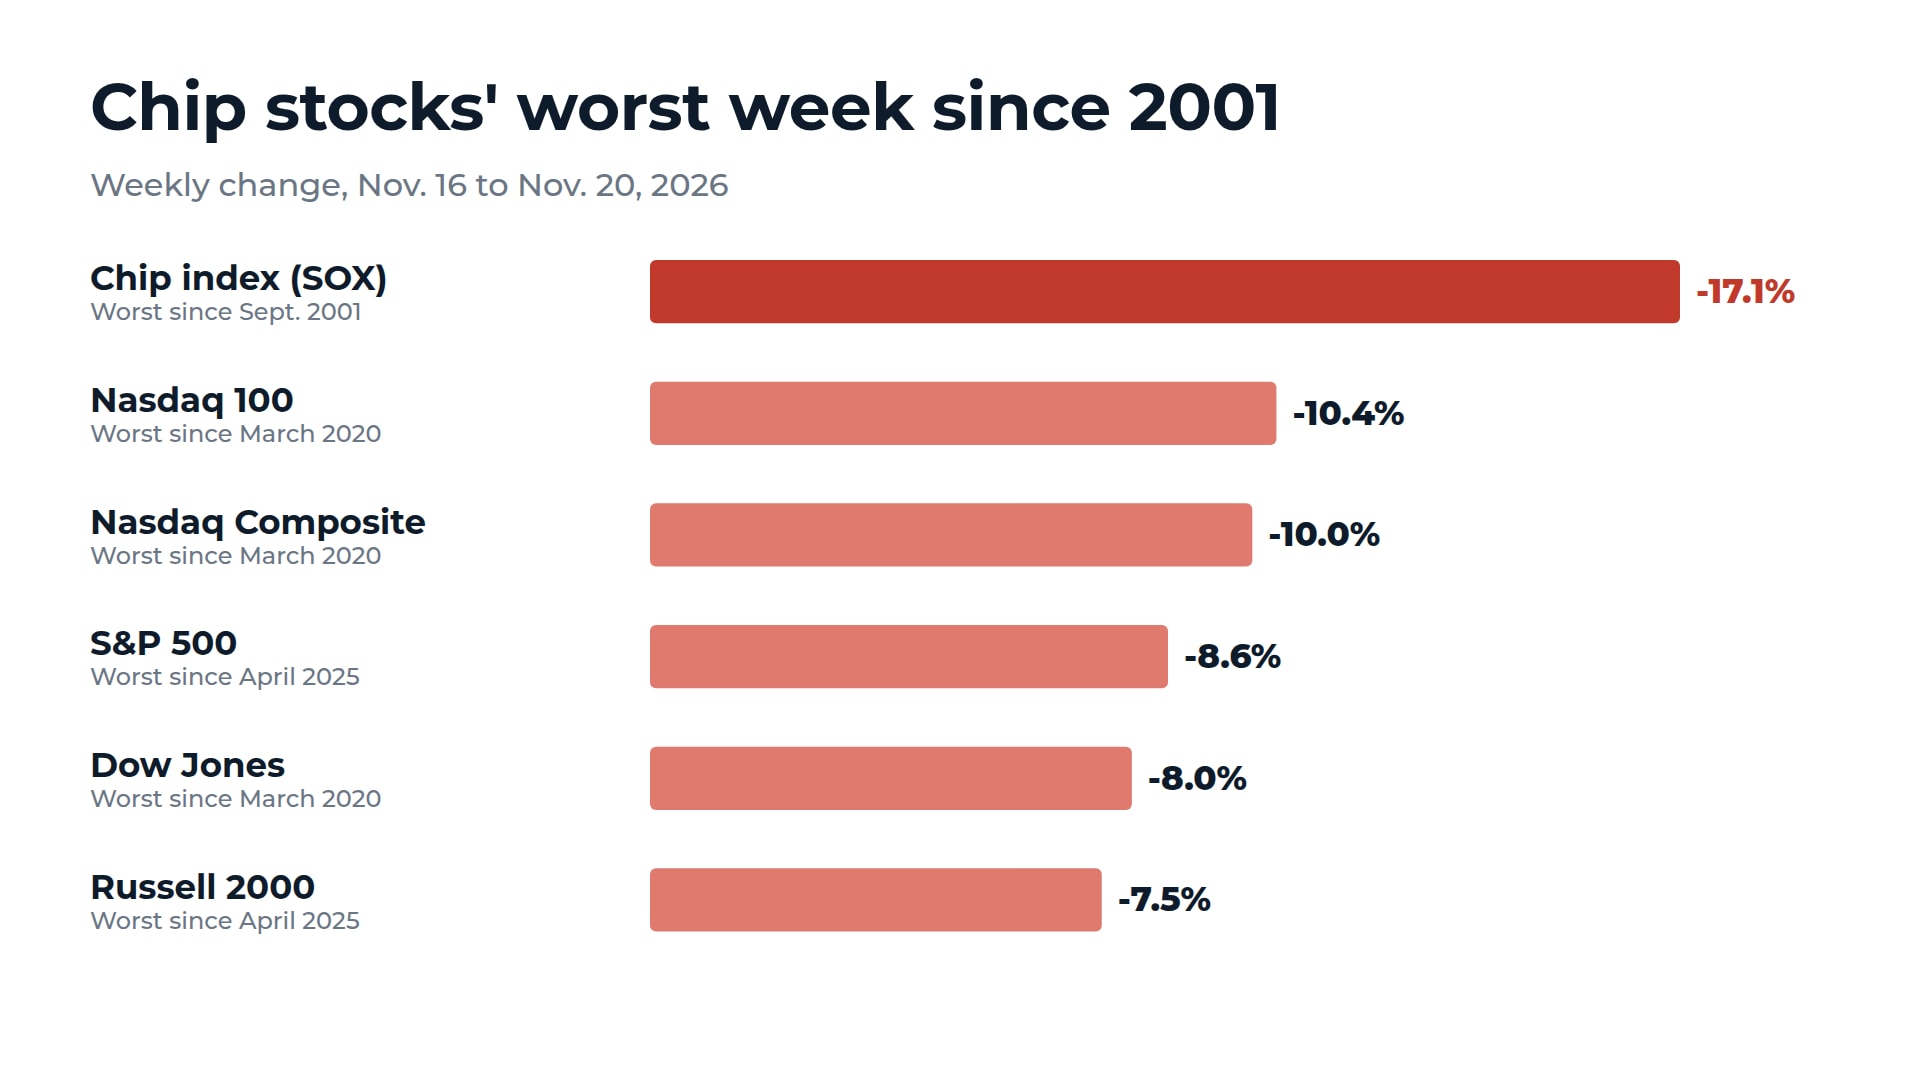
The VIX closed at 35.89 on Nov. 20, up from 19.30 a week earlier, and touched 40.03 during the day. That's its highest close since April 11, 2025. The S&P 500 closed at 6,910.39, which put it in a correction, 11.6% below its record. The Nasdaq Composite closed about 18% below its own Oct. 6 record.
The S&P 500 was higher a year later after 14 of 17 VIX spikes
Cboe's daily VIX history starts in 1990. I counted the first close at or above 35 in each episode, and I didn't count a new one until the VIX had spent at least 60 trading days below 35. I measured S&P 500 returns from the close on each of those days, and a year means 252 trading days throughout.
| Time after the VIX closed above 35 | Median S&P 500 change | Higher in | Median for any day since 1990 |
|---|---|---|---|
| 1 month | +5.7% | 12 of 17 | +1.2% |
| 3 months | +10.4% | 13 of 17 | +3.2% |
| 6 months | +16.8% | 15 of 17 | +5.7% |
| 12 months | +21.6% | 14 of 17 | +11.9% |
Source: Cboe daily VIX closes since Jan. 2, 1990; Yahoo Finance daily S&P 500 closes. One, three, six, and 12 months are 21, 63, 126, and 252 trading days.
The median 12-month gain after a VIX spike was 21.6%, almost double the 11.9% median for any day since 1990. The Nasdaq Composite's median 12-month gain after the same 17 days was 26.8%.
The fast recoveries are the ones people remember. The VIX closed at 45.31 on April 4, 2025, during the tariff selloff, and the S&P 500 was up 33.7% a year later. In three cases (Jan. 14, 1991; Oct. 30, 1997; and Dec. 24, 2018), the day the VIX crossed 35 was also the S&P 500's lowest close of the next year.
Seven of the 17 had another big leg down first
The medians hide a lot of pain. In seven of the 17 cases, the S&P 500 fell at least another 10% at some point in the next year. Across all 17, the median further drop was 7.9%.
| First VIX close above 35 | VIX close | Further S&P 500 drop | Low close | S&P 500 a year later |
|---|---|---|---|---|
| Aug. 6, 1990 | 35.91 | -11.7% | Oct. 11, 1990 | +15.1% |
| Sept. 17, 2001 | 41.76 | -23.2% | July 23, 2002 | -15.9% |
| July 15, 2002 | 35.03 | -15.4% | Oct. 9, 2002 | +9.0% |
| Sept. 17, 2008 | 36.22 | -41.5% | March 9, 2009 | -7.9% |
| Feb. 5, 2018 | 37.32 | -11.2% | Dec. 24, 2018 | +3.1% |
| Feb. 27, 2020 | 39.16 | -24.9% | March 23, 2020 | +27.9% |
| March 7, 2022 | 36.45 | -14.9% | Oct. 12, 2022 | -5.0% |
Source: Cboe daily VIX closes; Yahoo Finance daily S&P 500 closes. The further drop runs from the close on the day the VIX crossed 35 to the lowest close in the next 252 trading days, and "a year later" is 252 trading days after the VIX crossed 35.
The 2020 case is the "bigger leg down, then huge recovery" story. The S&P 500 lost another 24.9% in less than four weeks after the VIX crossed 35, then was up 27.9% a year later, on Feb. 26, 2021.
The 2008 case is the one I keep coming back to. The VIX first closed above 35 on Sept. 17, 2008, two days after Lehman Brothers filed for bankruptcy. It didn't peak until Nov. 20, at 80.86, and the S&P 500 didn't bottom until March 9, 2009. Warren Buffett wrote in a New York Times op-ed published on Oct. 16, 2008, that "A simple rule dictates my buying: Be fearful when others are greedy, and be greedy when others are fearful." The S&P 500 fell another 28.5% from that day's close before it hit bottom. It was still up 14.9% a year later, on Oct. 16, 2009.
The VIX stayed under 35 for most of the dot-com crash
The dot-com crash is the comparison that matters most for AI stocks, and it's a reminder of what the 17 VIX episodes leave out. The VIX is built from S&P 500 options, not Nasdaq options, so it won't always track a selloff in tech stocks. Still, the S&P 500 fell 28.5% (coincidentally, the same drop as after Buffett's op-ed) from its March 24, 2000, record close through Sept. 10, 2001, and the Nasdaq fell 66.4% from its March 10, 2000, record over the same stretch. The VIX never closed above 35 in that time. Its highest close was 34.72, on April 3, 2001, and it crossed 35 only after the Sept. 11 attacks. A slow decline doesn't always set off the fear gauge, so a calm VIX in 2000 wasn't a sign the worst was over.
The VIX only measures expected volatility in the broad market. For the AI trade itself, I checked our AI bubble index, which we built to ask whether AI stocks are in a bubble, and it splits in a way the VIX can't show. The index read 53 on Nov. 20, down from its peak of 63 on Oct. 10. It dipped to 53 on Nov. 5 and rebounded to 60 by Nov. 11 before falling again. Compared with Oct. 10, much of the decline came from its market-based components: momentum fell from 59 to 10, valuation from 38 to 25, and complacency from 66 to 6. The complacency measure uses the VIX, so part of that drop reflects the same spike discussed above.
Other components moved higher. The measure tracking chipmakers' loans, guarantees, and lease backstops for customers reached 100, its maximum score, while insider selling rose from 65 to 78. To me, that looks more like prices deflating than a bubble that's over.
Put all of that together, and the VIX can't tell me which kind of selloff this is. In this sample, the median 12-month S&P 500 gain after the VIX's first close at or above 35 was 21.6%, well above the 11.9% median for all days since 1990. But in three of the 17 cases (2001, 2008, and 2022), the index was still lower a year later. I'm not rushing in. I'm watching a lot more closely than I was in July, though, because this is the first time since that call that the fear in the market looks more like an opportunity to me than a warning.
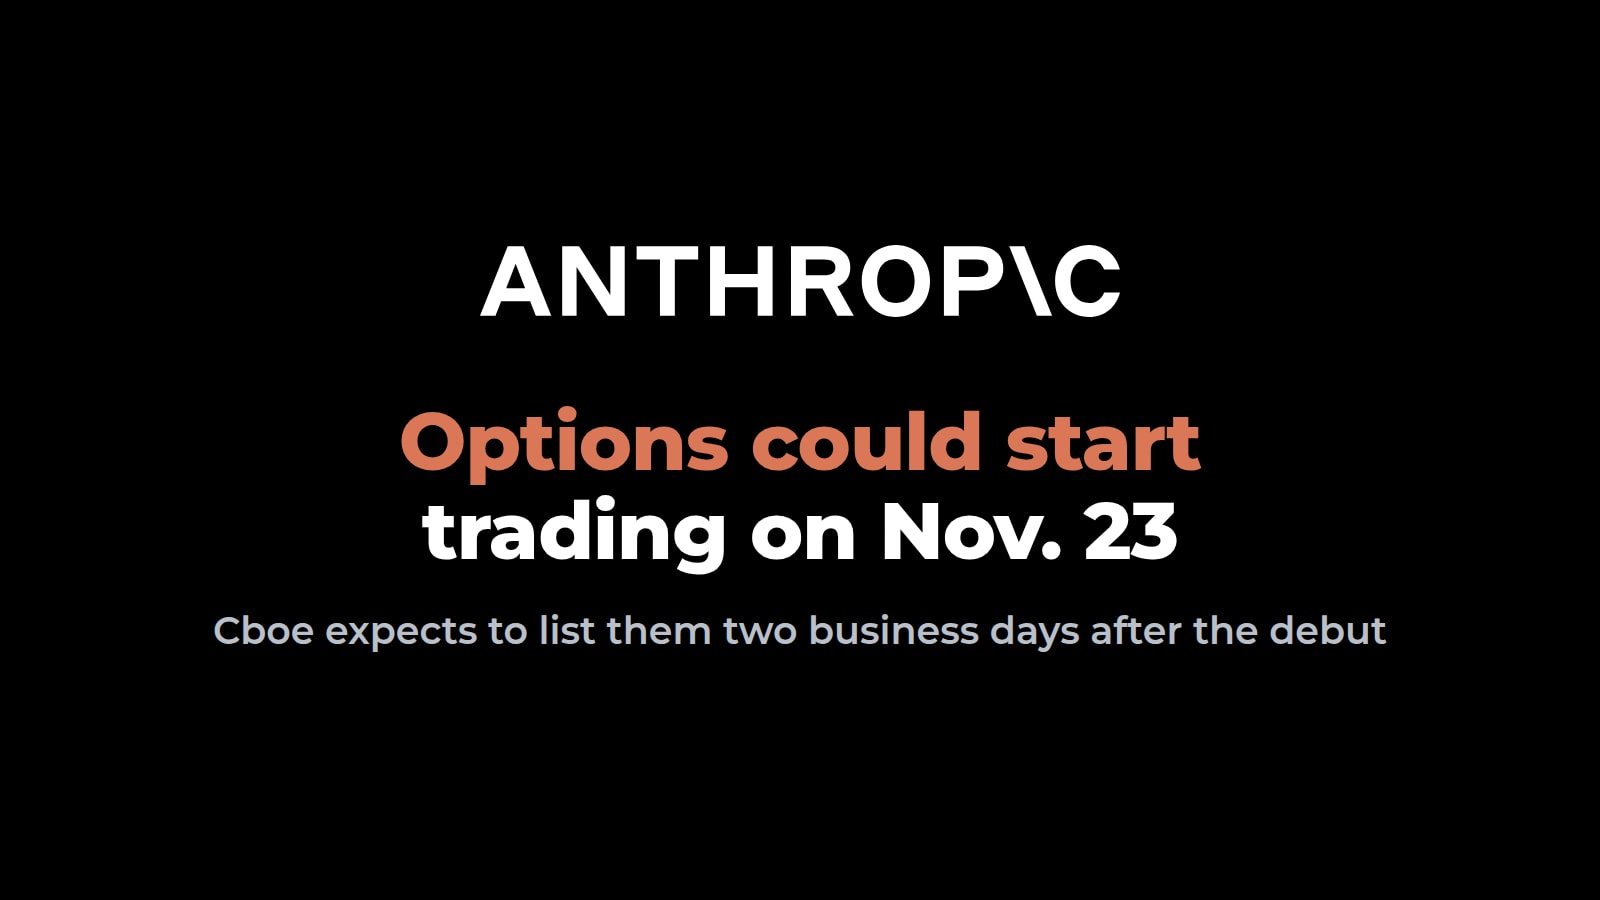
Two events to watch come quickly. Anthropic options are expected to start trading on Nov. 23, pending industry readiness, and the October PCE inflation report comes out on Nov. 25.
How I counted: A new episode starts on the first VIX close at or above 35 after at least 60 trading days below 35. Cboe's VIX history begins on Jan. 2, 1990, and the VIX closed below 35 on each of the first 150 trading days, so the first episode, on Aug. 6, 1990, meets the same rule. The 17 episodes began on Aug. 6, 1990; Jan. 14, 1991; Oct. 30, 1997; Aug. 27, 1998; Sept. 17, 2001; July 15, 2002; Sept. 17, 2008; May 7, 2010; Aug. 8, 2011; Aug. 24, 2015; Feb. 5, 2018; Dec. 24, 2018; Feb. 27, 2020; Oct. 28, 2020; March 7, 2022; Aug. 5, 2024; and April 4, 2025. Some fall within months of each other, and each counts as its own episode.